case study
Project Zero Threat Intelligence Dashboard
I completed and deployed the Project Zero Threat Intelligence Dashboard as an end-to-end cloud threat intelligence platform. I expanded the AWS Lambda pipeline to process six threat intelligence feeds, automated collection with Amazon EventBridge, implemented data retention controls, and migrated the application database to Neon PostgreSQL. I deployed the dashboard to Fly.io, implemented GitHub Actions CI/CD, validated end-to-end feed ingestion, and configured projectzerointel.com as the production HTTPS endpoint.
###Integration with the Cloud Lab
This project builds on the AWS threat intelligence pipeline developed in my Cloud Lab. Rather than rebuilding the backend infrastructure, I extended the existing pipeline to support additional intelligence feeds and provide the data required by the production dashboard.
-AWS Infrastructure — Reused the existing S3 storage, IAM configuration, and Lambda execution environment.
-Public Feed Processing — Extended the existing threat intelligence Lambda pipeline beyond the original Security News RSS feed.
-Database Integration — Continued using the private database ingestion Lambda to process stored JSON feeds and populate dashboard.panel_feed for the dashboard.
#Threat Intelligence Feed Integration
##Step 1 — Add Additional Threat Intelligence Feed Modules
I expanded the public-threat-intelligence-feed-parser Lambda function with the remaining Python feed modules required by the dashboard. Together with the existing Security News RSS feed, the function processes six threat intelligence feeds:
-Security News RSS
-Top 100 Domains
-Top IPs
-Top 10 Countries by IP
-Top Malware Hashes
-Top IOCs
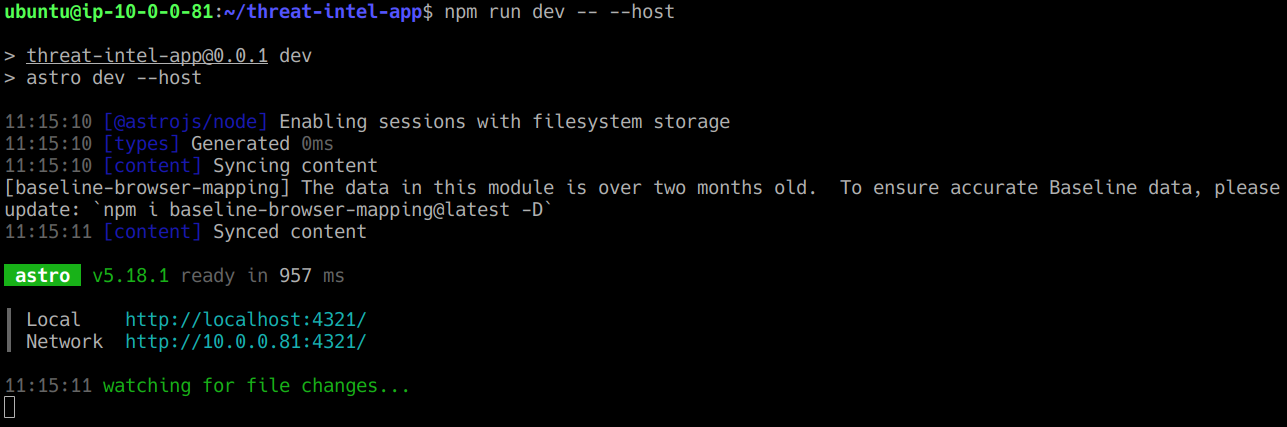
1.Start the Web Application
I started the ProjectZero Threat Intelligence Dashboard development server to verify the Astro application was running successfully before updating the feed parser.
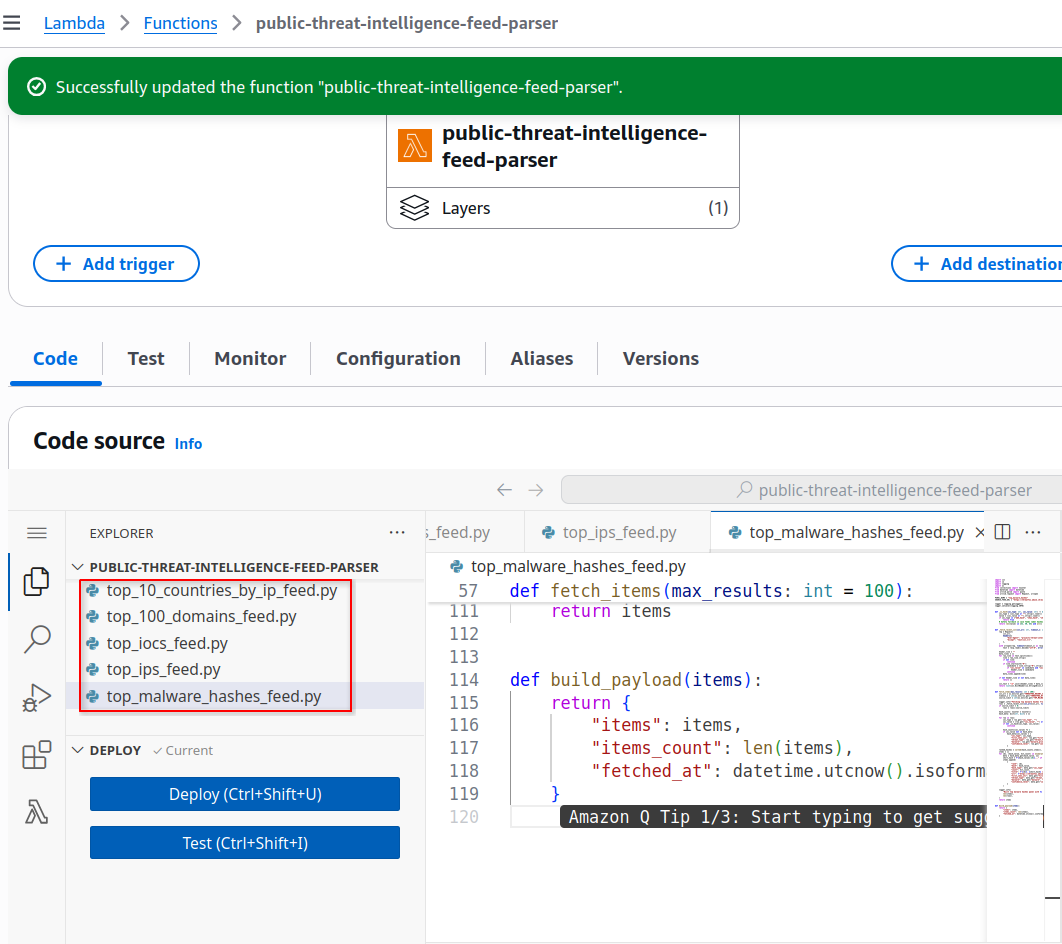
2.Update the Public Threat Intelligence Feed Parser
I updated the public-threat-intelligence-feed-parser deployment package to include the five additional feed modules required by the dashboard.
##Step 2 — Configure GeoIP Support for Top 10 Countries
I configured GeoIP support for the top_10_countries_by_ip feed so the Lambda function could map threat-source IP addresses to their associated countries. This required the GeoLite2 Country database and the geoip2 dependencies to be packaged into a Lambda layer.
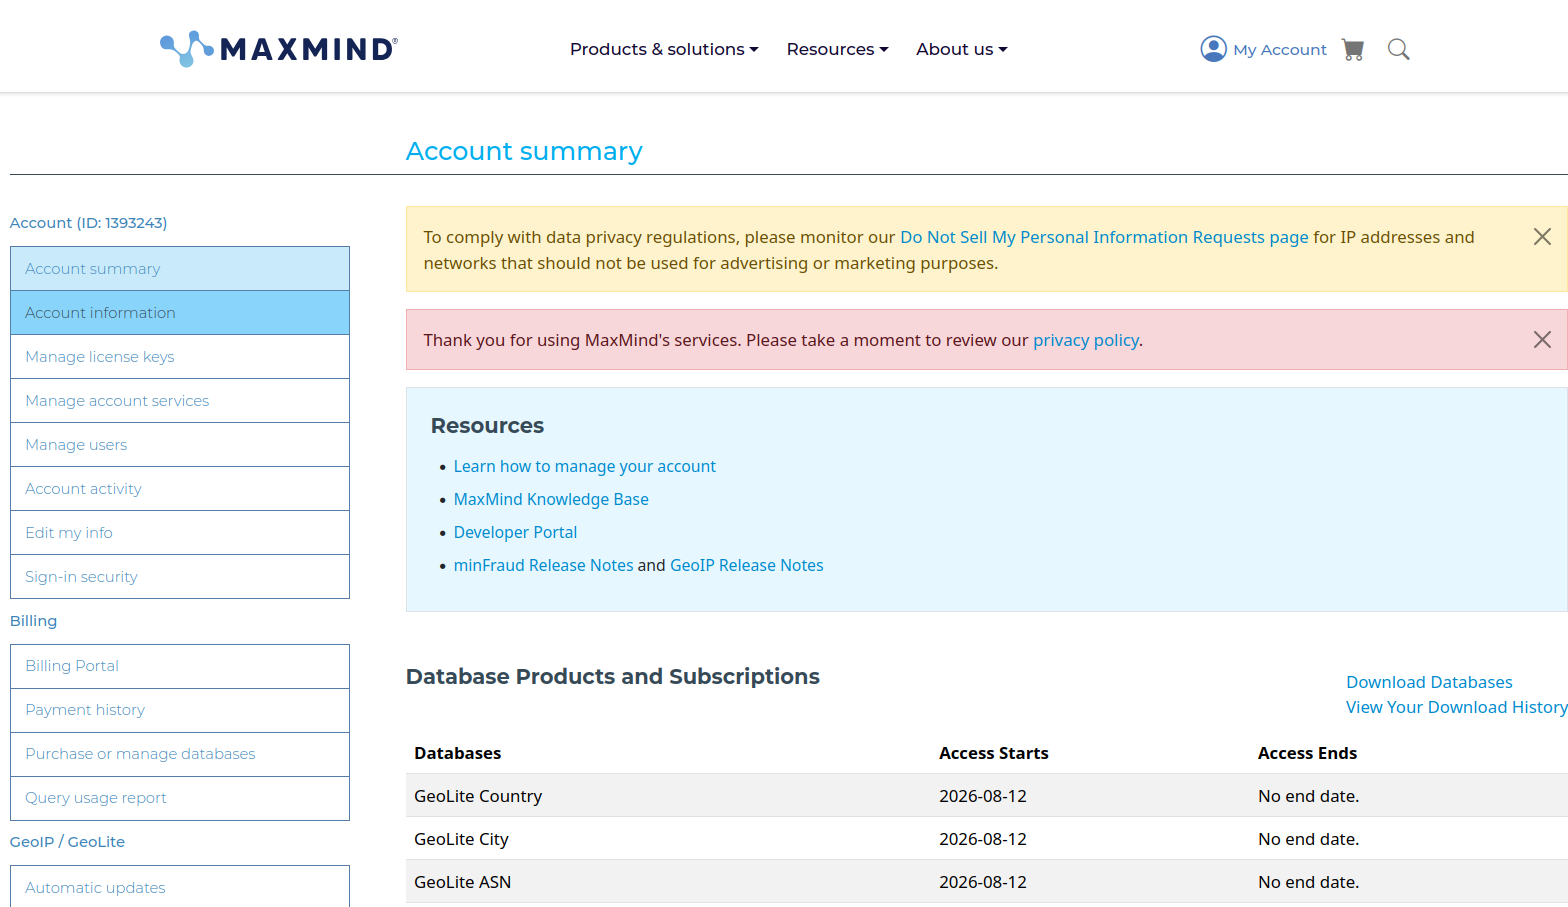
1.Create MaxMind GeoLite2 Account
I created a MaxMind account to obtain the GeoLite2 Country database required for IP geolocation.
https://www.maxmind.com/en/geolite2/signup
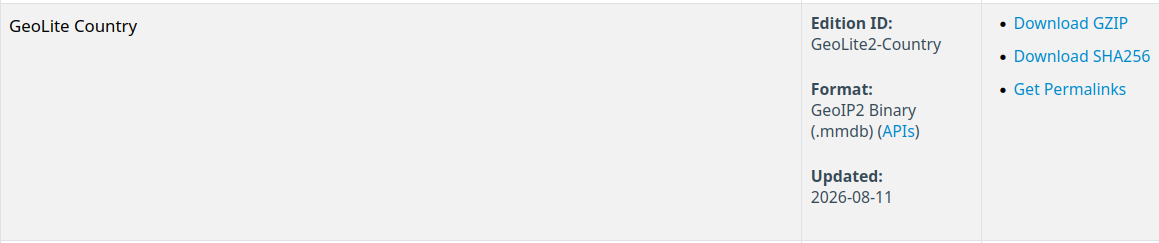
2.Download GeoLite2 Country Database
I downloaded the GeoLite2 Country database (GeoLite2-Country.mmdb) for inclusion in the Lambda layer.
3.Build GeoIP Lambda Layer
I built the Lambda layer containing the GeoLite2 database and required Python dependencies using the AWS Lambda Python environment.
sudo ./docker-build-layer.sh
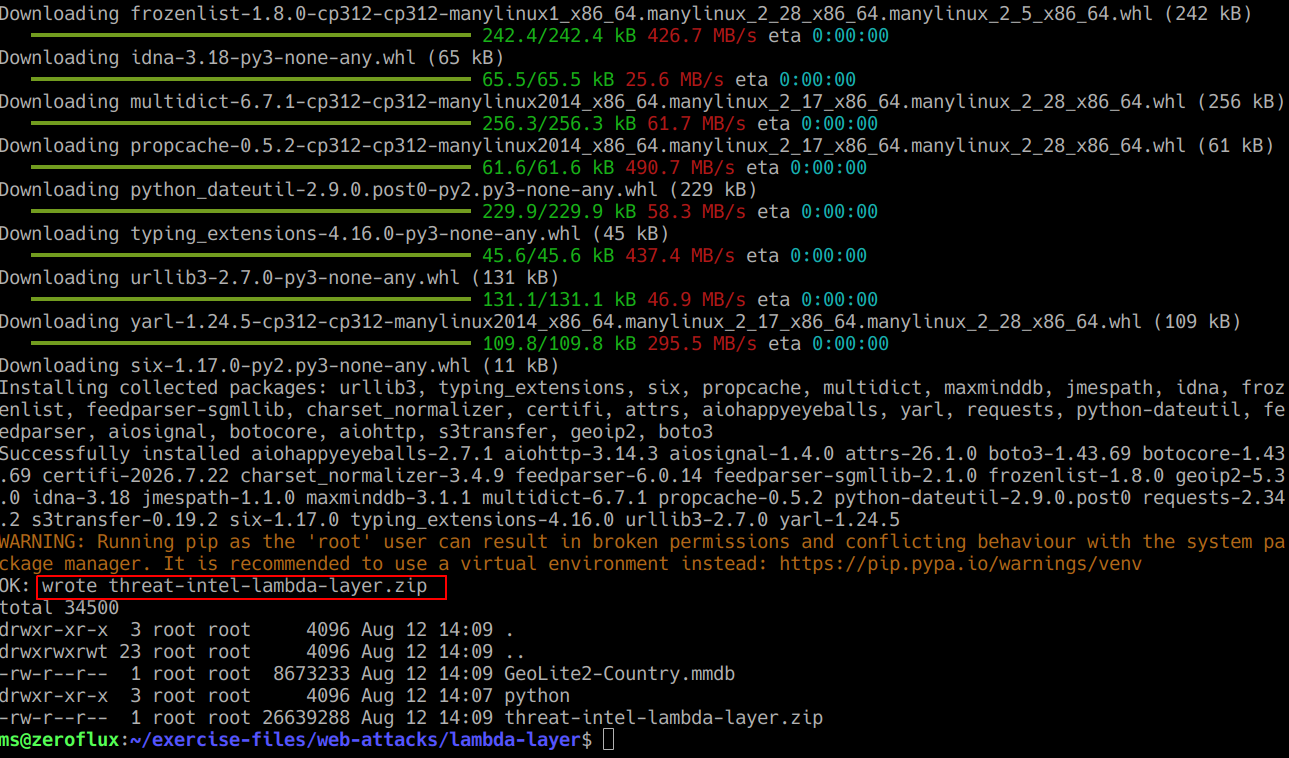
4.Verify Lambda Layer Package
I verified that the completed threat-intel-lambda-layer.zip package was generated successfully.

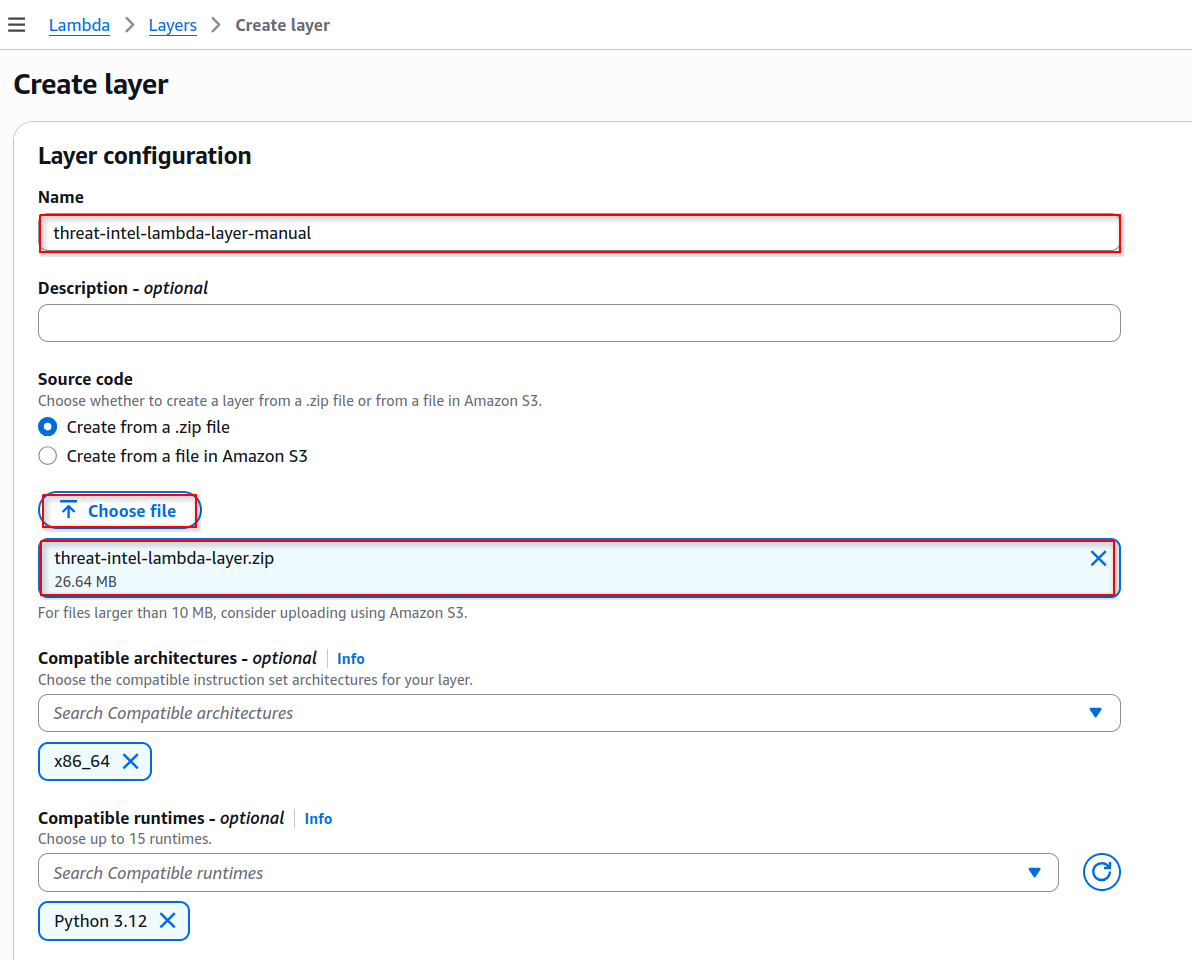
5.Create Lambda Layer
I created a custom AWS Lambda layer using the generated threat-intel-lambda-layer.zip package and configured it for the Python 3.12 runtime and x86_64 architecture.
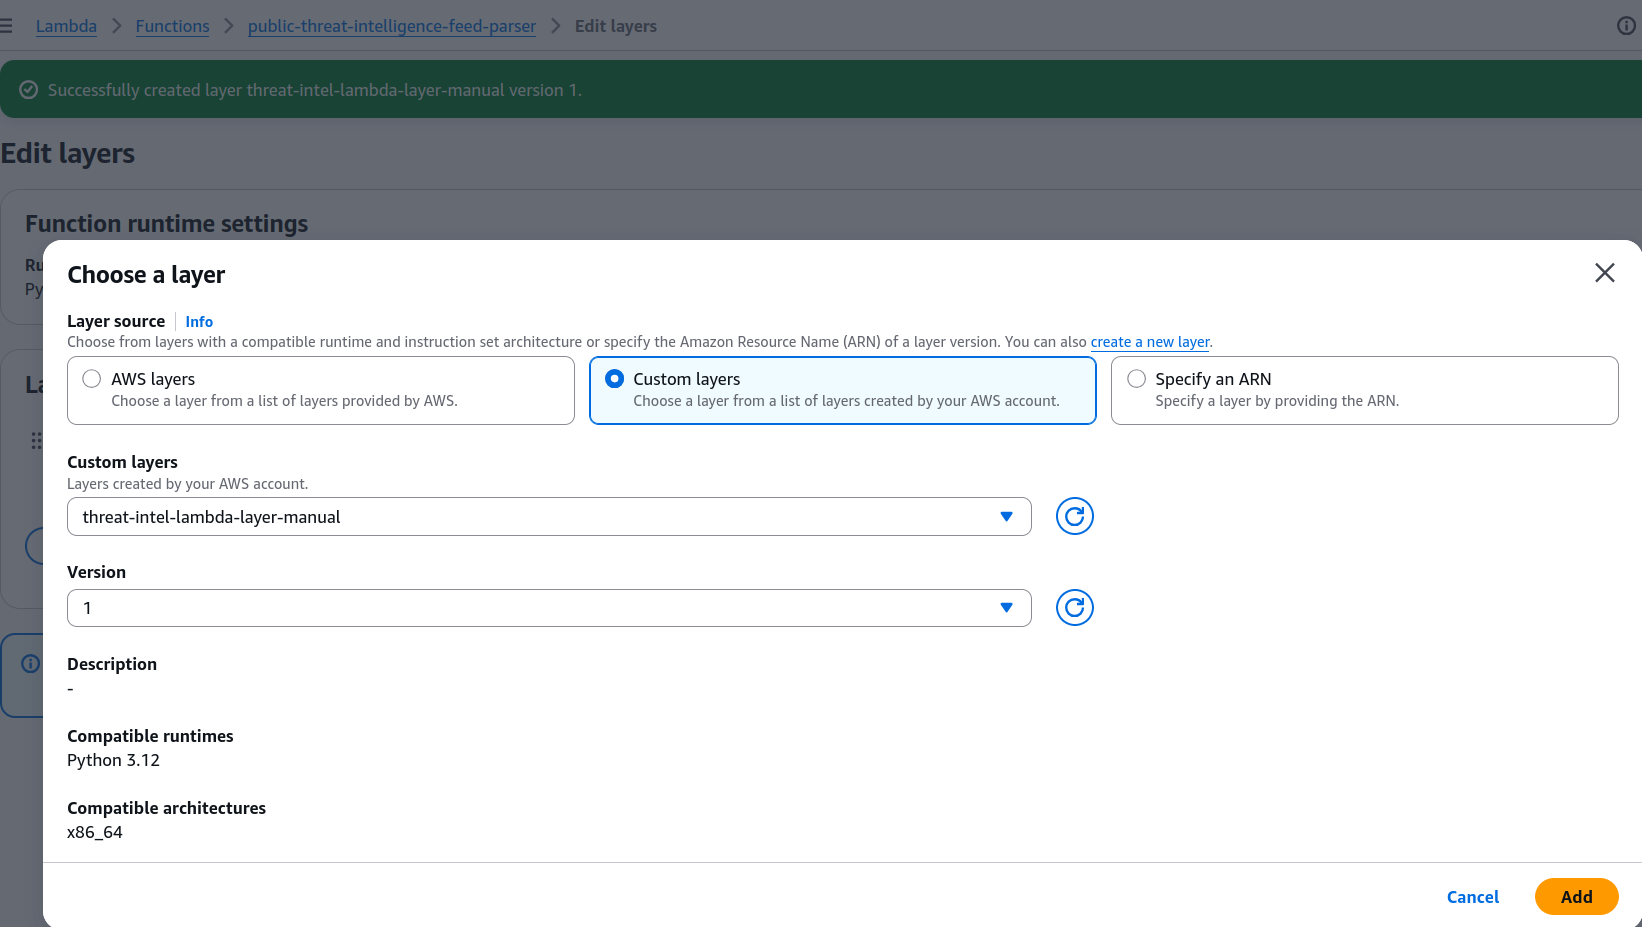
6.Attach Layer to Threat Intelligence Parser
I attached the custom GeoIP layer to the public-threat-intelligence-feed-parser, making the GeoLite2 database and required Python libraries available to the function at runtime.
## Step 3 — Configure Lambda Environment Variables
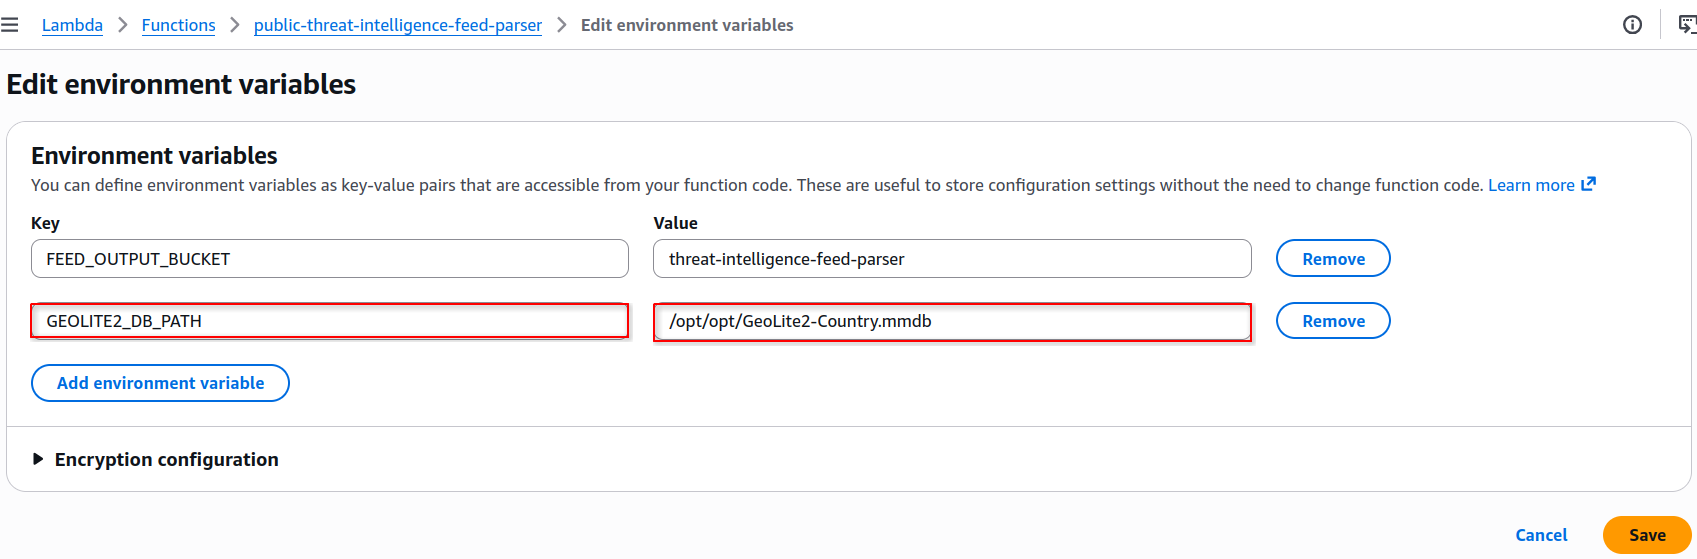
I configured the environment variables required by the public-threat-intelligence-feed-parser to define the output S3 bucket and provide the GeoLite2 database path used for IP geolocation.
1.Configure Feed Parser Environment
I added the required environment variables to the Lambda function configuration, including the feed output bucket and GeoLite2 database location.
##Step 4 — Test Threat Intelligence Feeds
I tested the individual threat intelligence feed modules through Lambda test events to verify that each parser successfully retrieved and processed its respective data source.
1.Test Feed Parser
I created a Lambda test event using the top_100_domains panel key and executed the function to verify successful feed retrieval and processing.

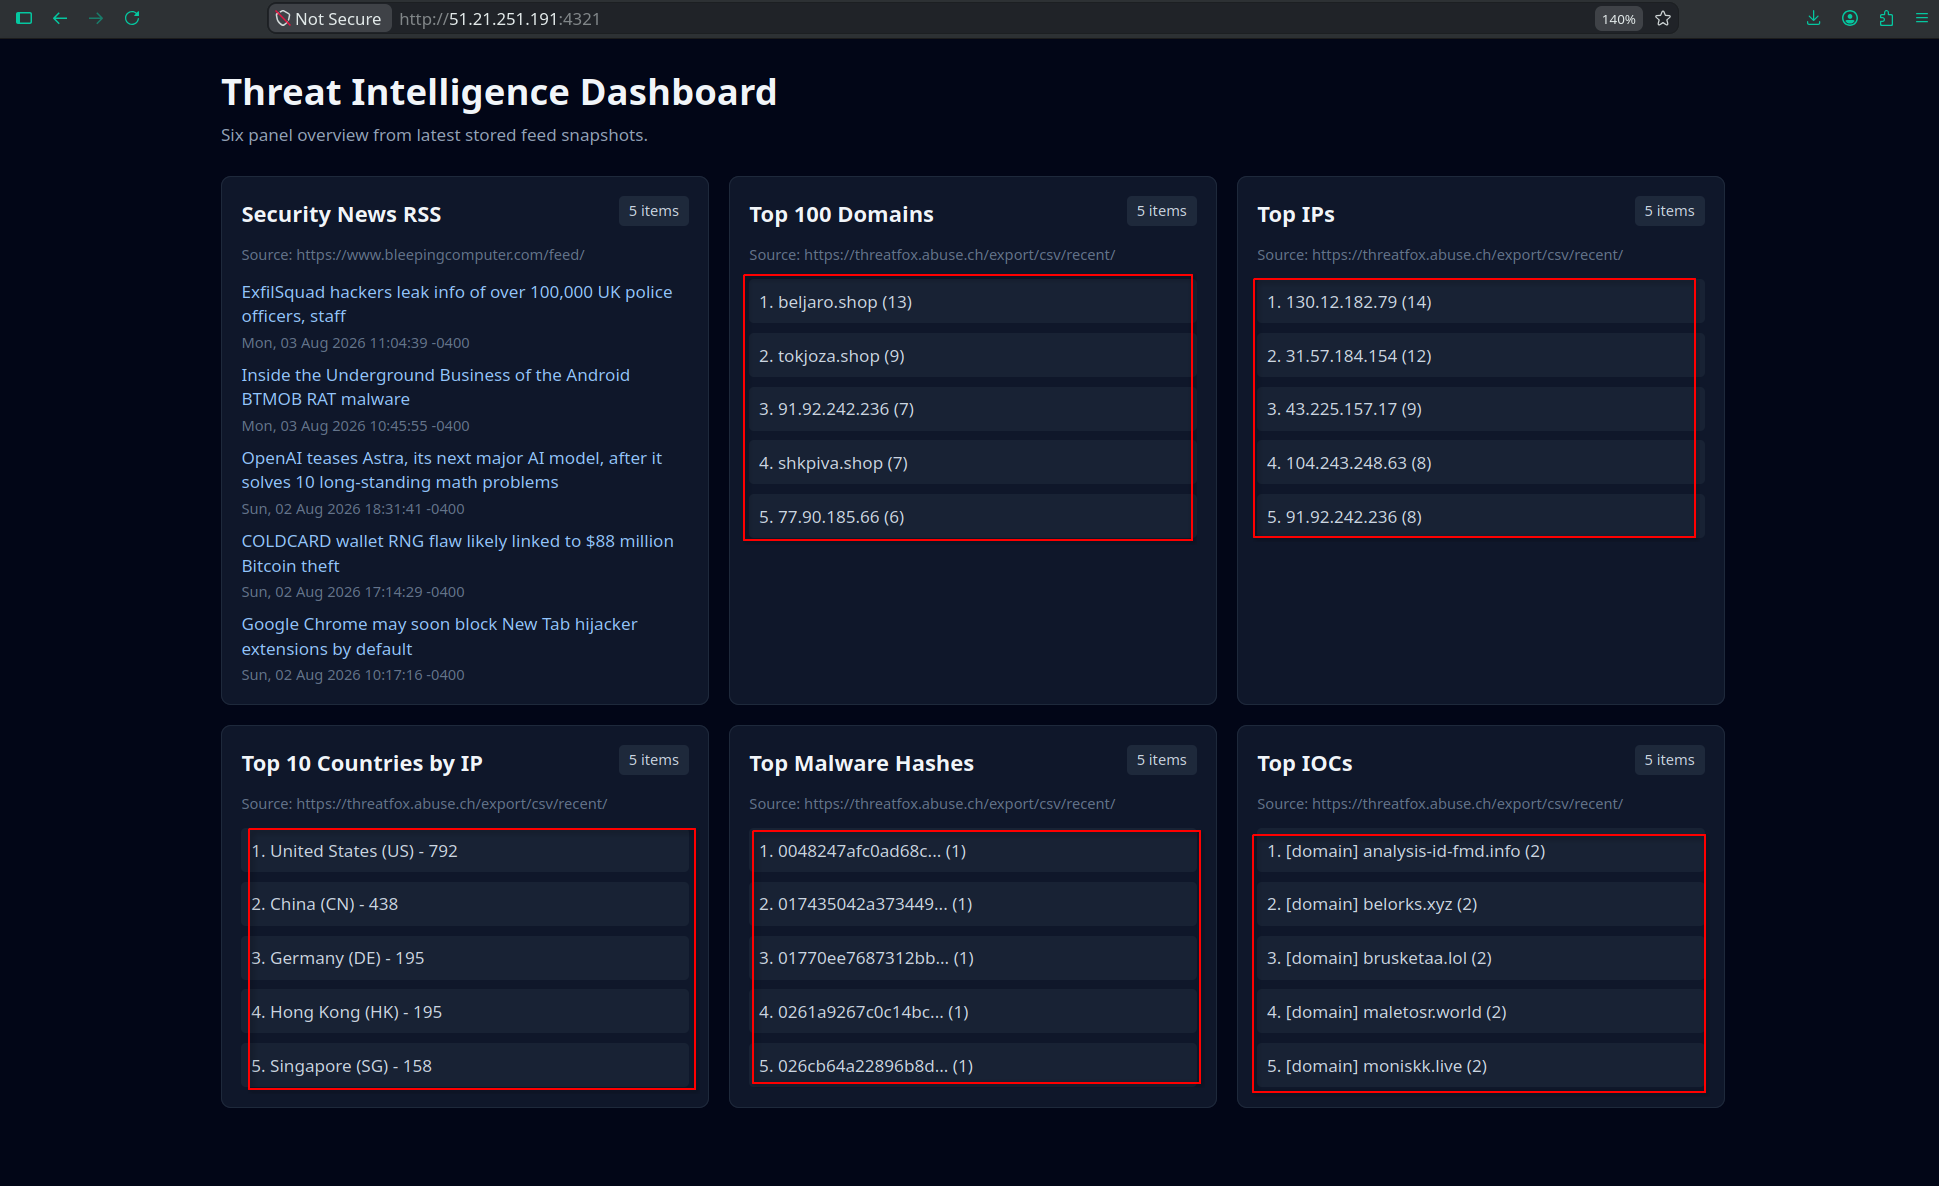
2.Verify Threat Intelligence Dashboard
After testing the feed modules, I verified the results through the ProjectZero Threat Intelligence Dashboard. All six panels successfully displayed their respective threat intelligence data, confirming the complete feed-processing workflow.
#Automate Threat Intelligence Feeds with EventBridge
I configured Amazon EventBridge Scheduler to automatically invoke the public-threat-intelligence-feed-parser Lambda function on recurring schedules, allowing the dashboard's threat intelligence feeds to refresh automatically without manual execution.
##Step 1 — Configure EventBridge Scheduler Permissions
I configured the permissions required for Amazon EventBridge Scheduler to invoke the public-threat-intelligence-feed-parser Lambda function. I created a dedicated IAM execution role with a trust policy allowing EventBridge Scheduler to assume the role, granted least-privilege lambda:InvokeFunction access to the feed parser, and configured the Lambda permissions required for scheduled invocation.
1.Configure Trust Policy
I configured the role's trust policy to allow the EventBridge Scheduler service to assume the execution role.
{
  "Version": "2012-10-17",
  "Statement": [
    {
      "Sid": "TrustEventBridgeScheduler",
      "Effect": "Allow",
      "Principal": {
        "Service": "scheduler.amazonaws.com"
      },
      "Action": "sts:AssumeRole",
      "Condition": {
        "StringEquals": {
          "aws:SourceAccount": "ACCOUNT_ID"
        }
      }
    }
  ]
}2.Configure Lambda Invoke Permission
I applied a least-privilege permissions policy granting the scheduler permission to invoke only the public-threat-intelligence-feed-parser Lambda function.
{
  "Version": "2012-10-17",
  "Statement": [
    {
      "Sid": "InvokePublicThreatIntelligenceFeedParser",
      "Effect": "Allow",
      "Action": "lambda:InvokeFunction",
      "Resource": "arn:aws:lambda:REGION:ACCOUNT_ID:function:public-threat-intelligence-feed-parser"
    }
  ]
}3.Allow EventBridge Scheduler to Invoke Lambda
I configured the Lambda resource-based permissions required for EventBridge Scheduler to invoke the feed parser.
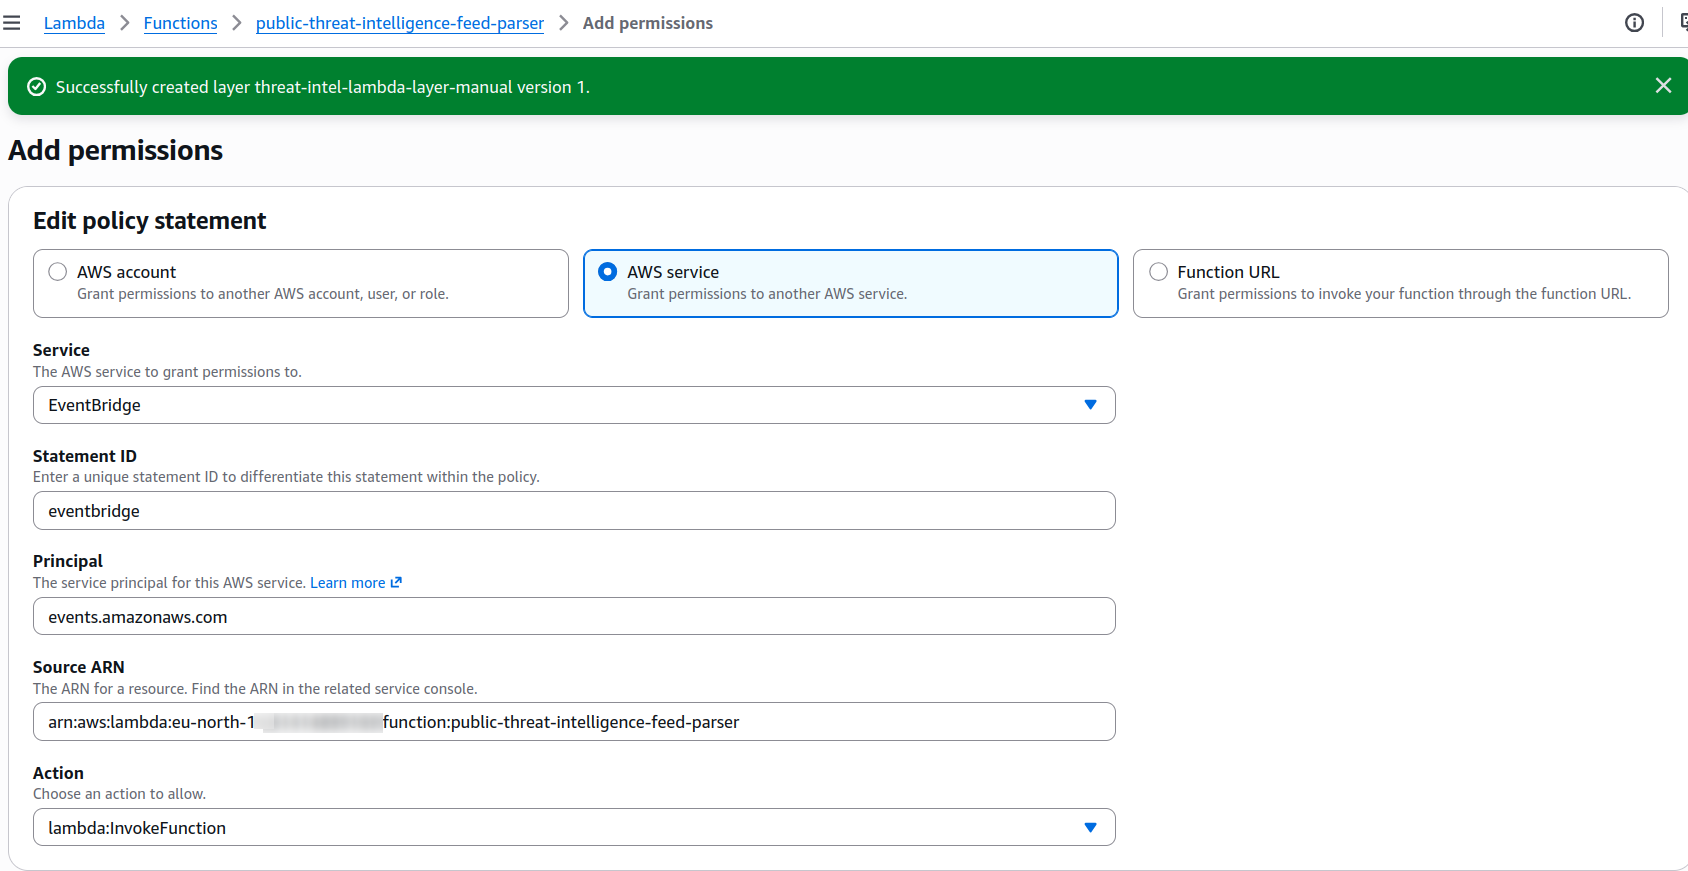
public-threat-intelligence-feed-parser Lambda function.##Step 2 — Create Automated Feed Schedules
I created recurring Amazon EventBridge schedules to invoke the public-threat-intelligence-feed-parser Lambda function automatically. Each schedule targets a specific threat intelligence feed using a unique panel_key, allowing all six dashboard feeds to refresh without manual execution.
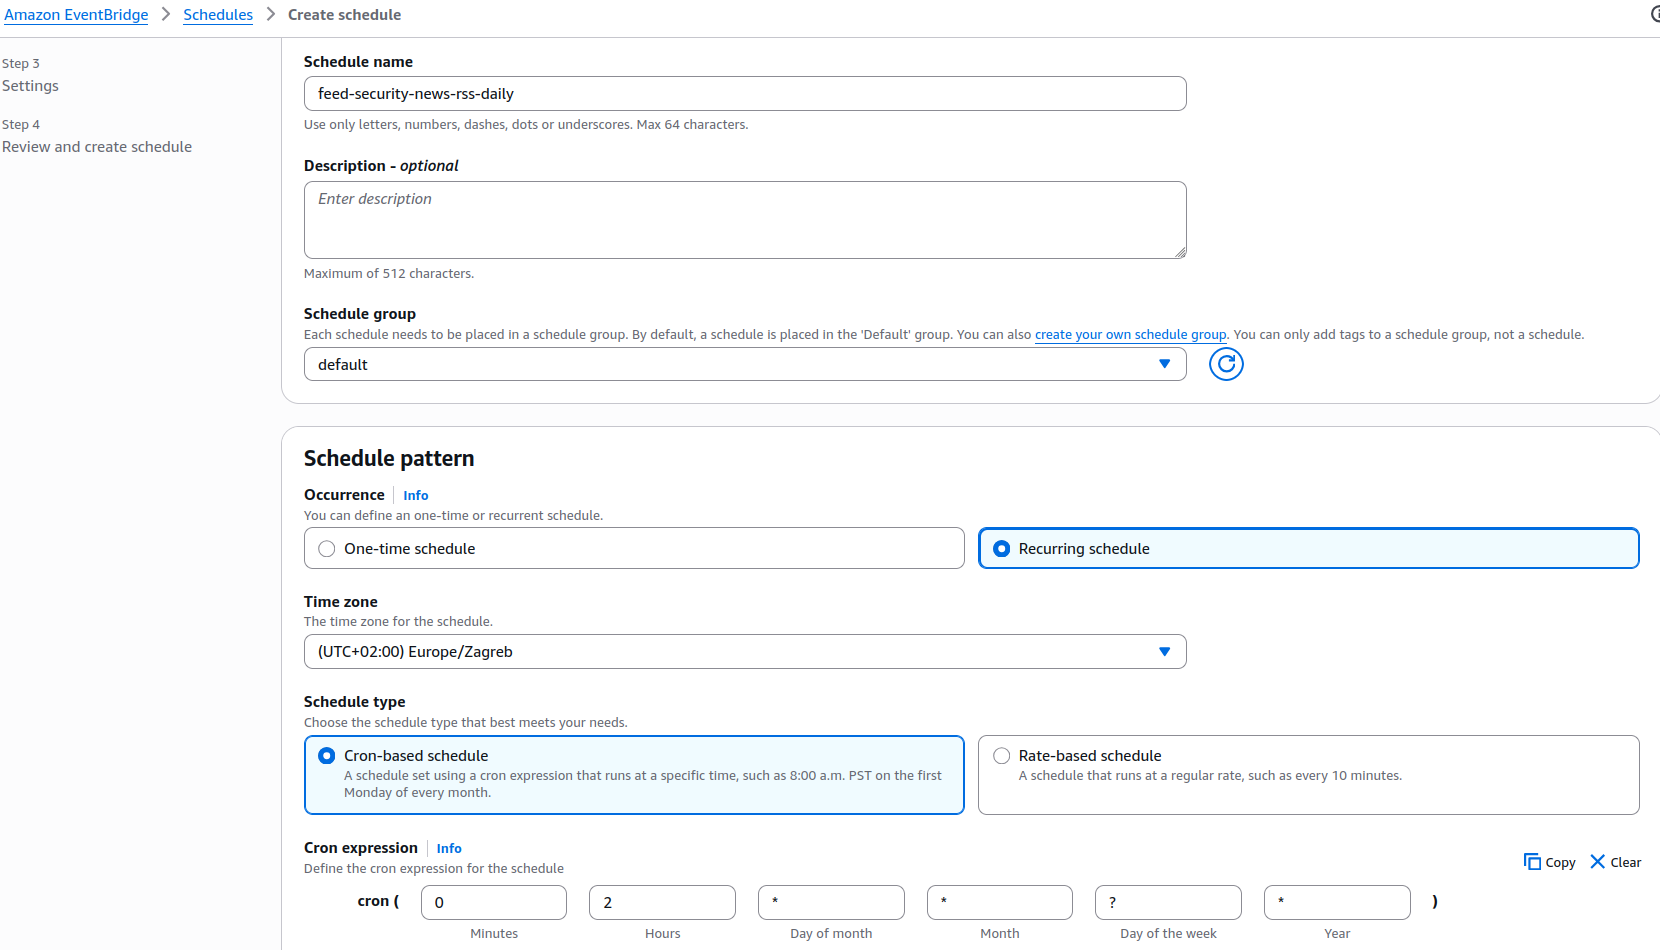
1.Configure Daily Schedule
I configured the schedules to run daily at 2:00 AM using EventBridge Scheduler with a defined timezone and cron-based schedule.
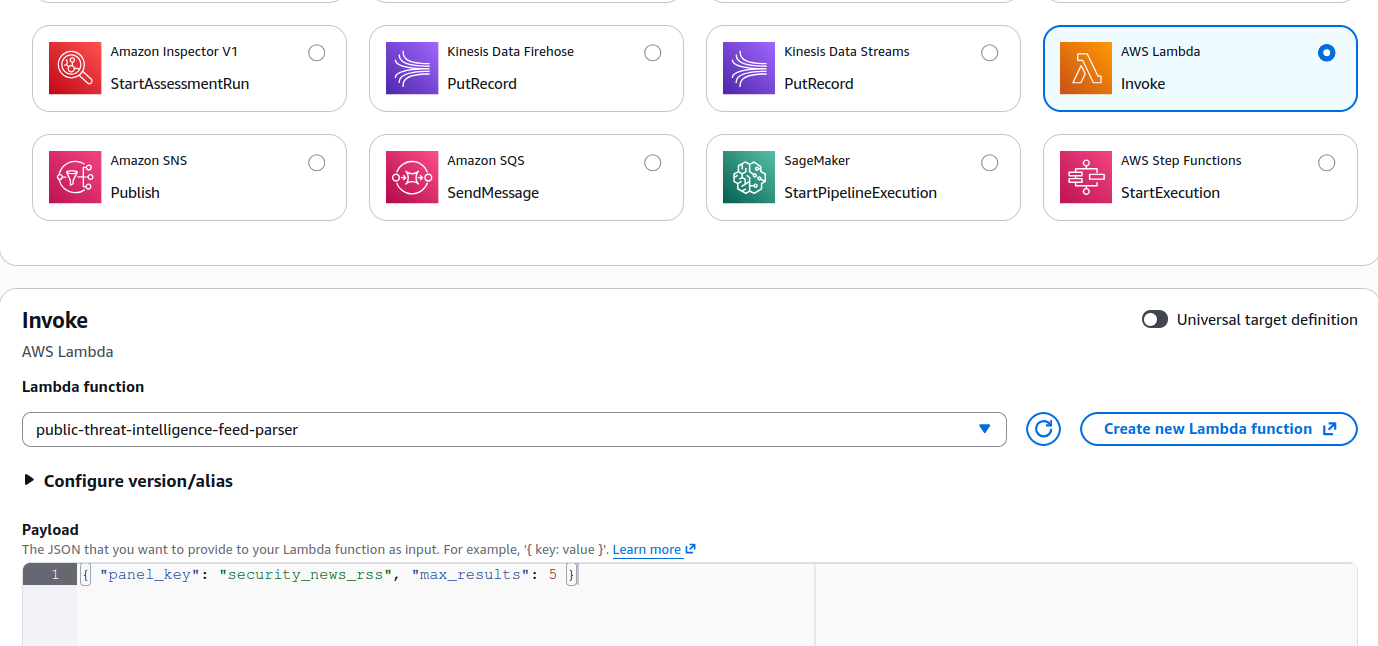
2.Configure Lambda Target and Payload
I selected public-threat-intelligence-feed-parser as the schedule target and supplied a JSON payload identifying which dashboard feed the Lambda function should process.
| Feed | panel_key | Results |
| Security News RSS | security_news_rss | 5 |
| Top 100 Domains | top_100_domains | 10 |
| Top IPs | top_ips | 10 |
| Top 10 Countries by IP | top_10_countries_by_ip | 10 |
| Malware Hashes | top_malware_hashes | 25 |
| IOCs | top_iocs | 25 |
{
  "panel_key": "security_news_rss",
  "max_results": 5
}
3.Assign EventBridge Execution Role
I assigned the EventBridge Scheduler execution role created in Step 1, allowing the schedule to invoke the Lambda function with the required permissions.
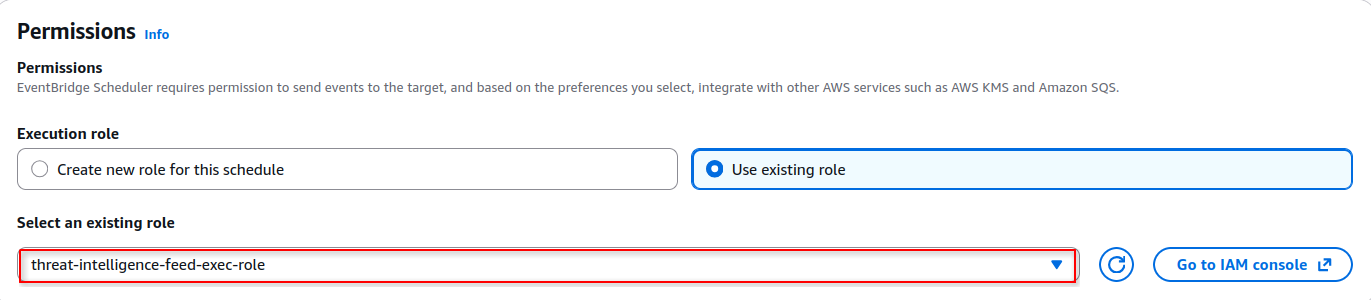
I repeated the schedule configuration for all six panel_key values, reusing the same Lambda target and execution role while changing the schedule name and JSON payload for each feed.
4.Verify Feed Schedules
I verified that all six EventBridge schedules were created successfully and enabled. Each schedule targets the public-threat-intelligence-feed-parser Lambda function, providing automated execution for each dashboard threat intelligence feed.
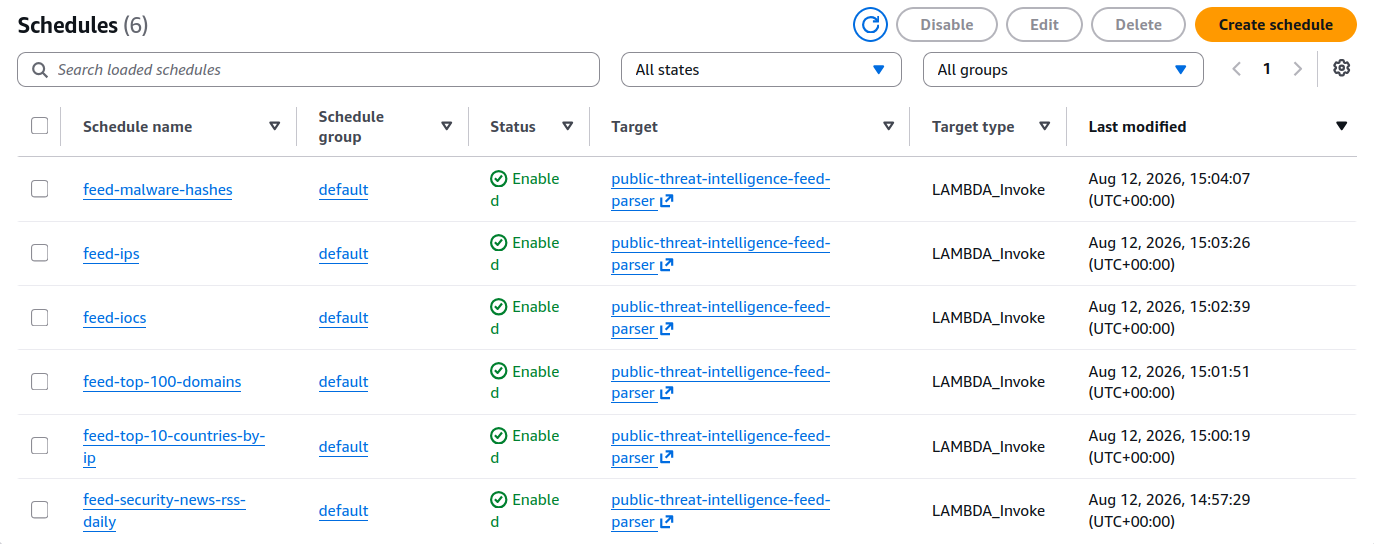
public-threat-intelligence-feed-parser Lambda function.#S3 Bucket Lifecycle Policy
I implemented a 14-day rolling retention policy for the threat intelligence pipeline to prevent historical feed data from accumulating indefinitely. Amazon S3 lifecycle rules automatically expire old JSON feed snapshots, while PostgreSQL cleanup removes outdated records from dashboard.panel_feed. This keeps both storage layers bounded while preserving the most recent data used by the dashboard.
1.Configure S3 Lifecycle Retention
I configured a lifecycle rule on the threat-intelligence-feed-parser bucket to expire objects after 14 days.
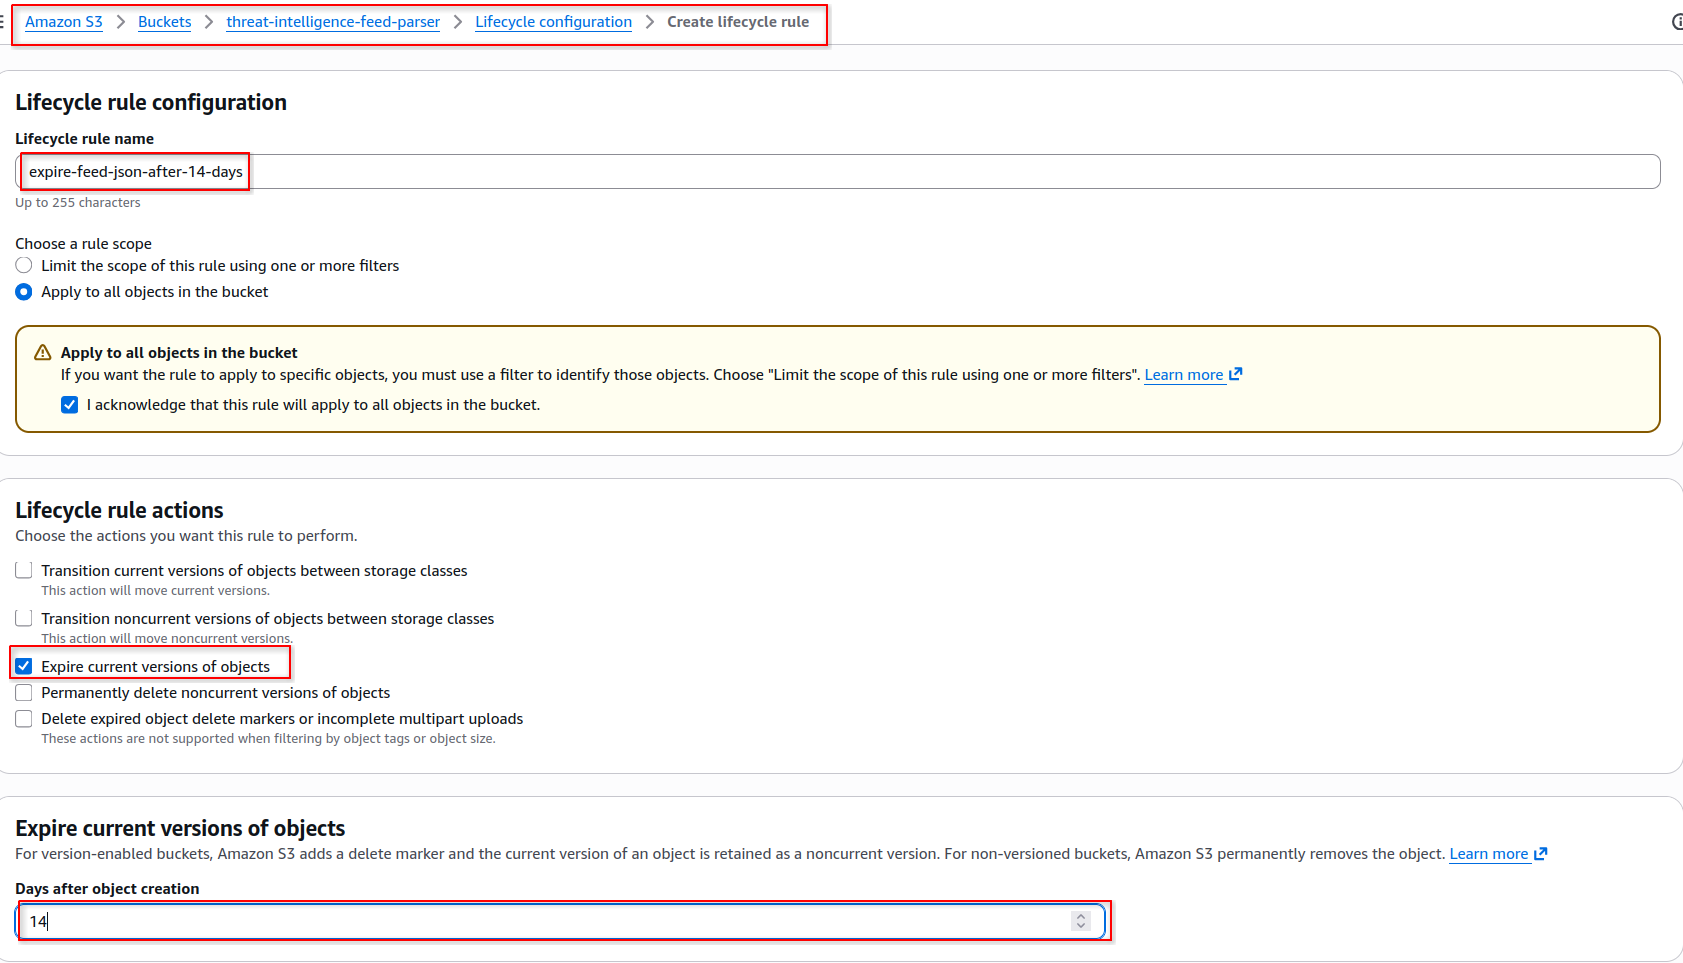
threat-intelligence-feed-parser S3 bucket with a lifecycle rule to automatically expire feed objects after 14 days.#Deploy the threat intelligence dashboard (Fly.io + Neon)
I deployed the ProjectZero Threat Intelligence Dashboard using Fly.io and Neon PostgreSQL, migrating the application to a managed cloud deployment. I configured the database schema and feed records, verified remote database connectivity, deployed the containerized application to Fly.io, and securely configured the database connection using Fly.io application secrets.
1.Configure Neon PostgreSQL
I created the dashboard schema and panel_feed table in Neon PostgreSQL, including an index on panel_name and collected_at to support retrieval of the latest threat intelligence feed data.
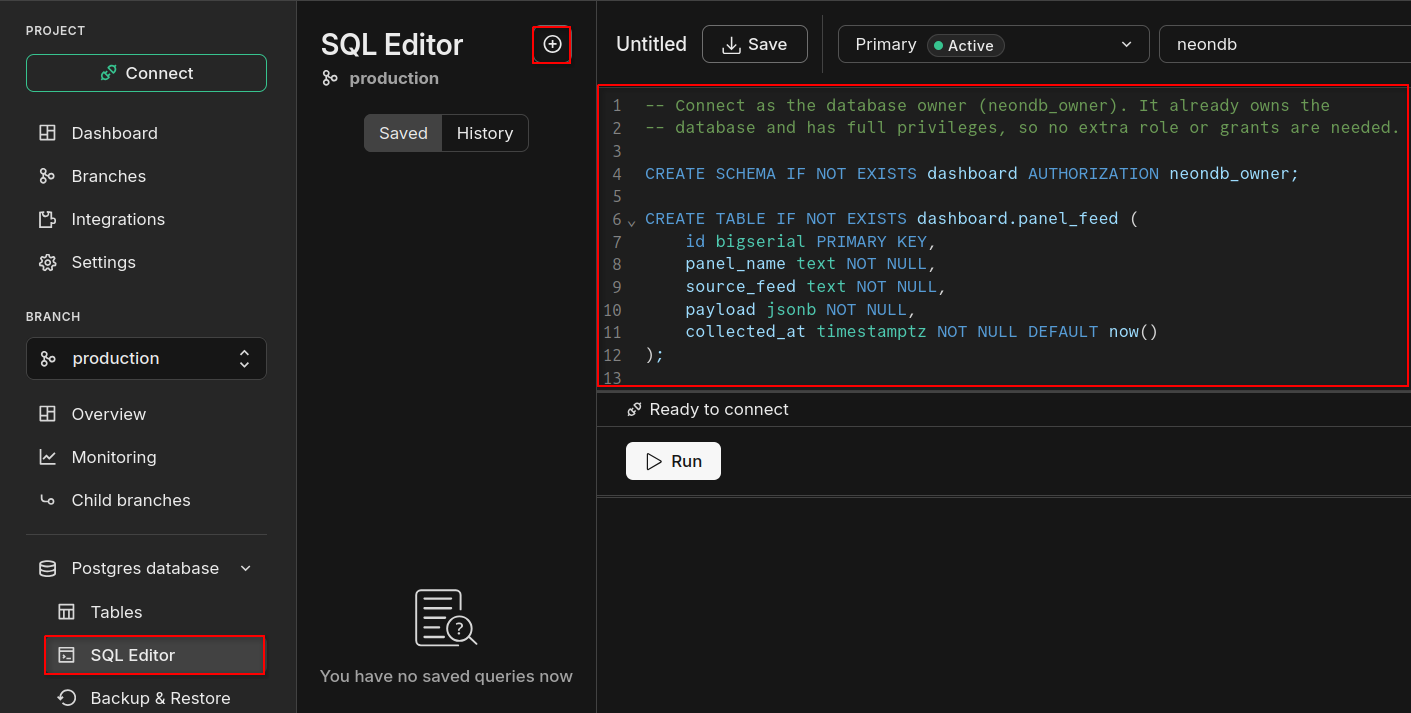
dashboard.panel_feed schema and table in Neon PostgreSQL.-- Connect as the database owner (neondb_owner). It already owns the
-- database and has full privileges, so no extra role or grants are needed.
CREATE SCHEMA IF NOT EXISTS dashboard AUTHORIZATION neondb_owner;
CREATE TABLE IF NOT EXISTS dashboard.panel_feed (
id bigserial PRIMARY KEY,
panel_name text NOT NULL,
source_feed text NOT NULL,
payload jsonb NOT NULL,
collected_at timestamptz NOT NULL DEFAULT now()
);
CREATE INDEX IF NOT EXISTS idx_panel_feed_name_collected
ON dashboard.panel_feed (panel_name, collected_at DESC);2.Seed Threat Intelligence Panel Data
I seeded the database with placeholder records for all six dashboard feeds to validate the schema and prepare the application for live threat intelligence ingestion.

dashboard.panel_feed.3.Verify Database Connectivity
I verified remote connectivity to the Neon PostgreSQL database and confirmed that dashboard.panel_feed contained all six expected records.
psql "postgresql://neondb_owner:YOUR_PASSWORD@ep-xxxx.region.aws.neon.tech/neondb?sslmode=require" \
  -c "SELECT COUNT(*) FROM dashboard.panel_feed;"
4.Configure the Application for Fly.io
I updated the application's fly.toml configuration with a unique Fly.io application name before deployment, ensuring the deployment used my own application instance and configuration.

fly.toml with the ProjectZero application name and Docker-based deployment settings.
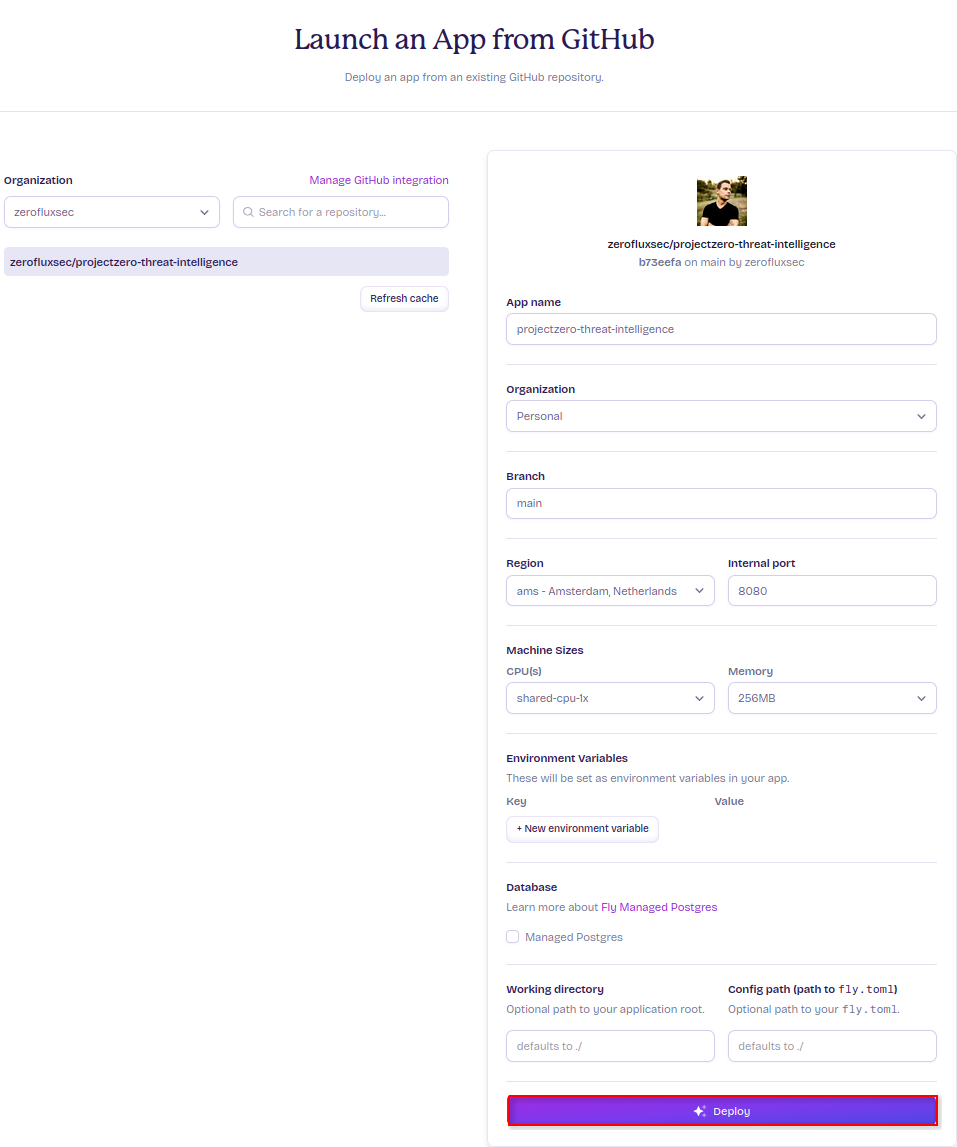
5.Deploy the Dashboard to Fly.io
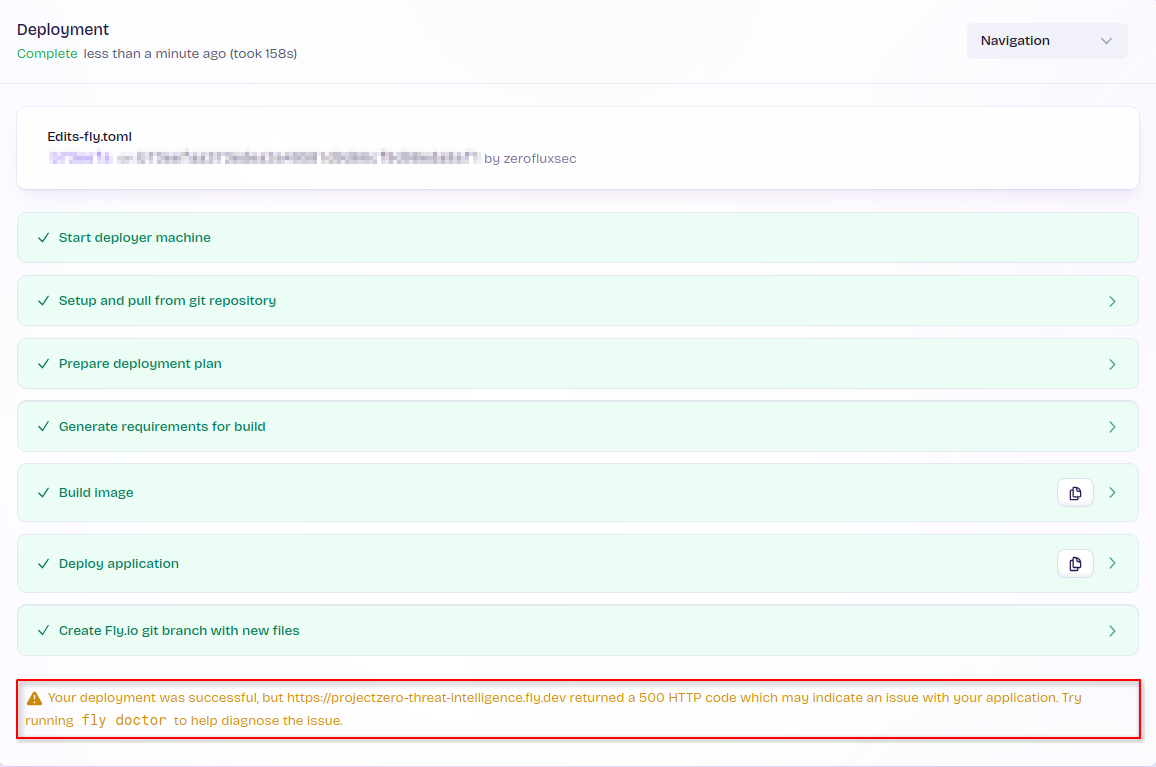
I deployed the ProjectZero Threat Intelligence Dashboard to Fly.io directly from the GitHub repository. The initial deployment successfully built and launched the application, but returned an HTTP 500 error because the application did not yet have the required Neon database connection secret.
6.Configure Fly.io Database Secrets
I configured the Fly.io application with the Neon PostgreSQL connection parameters as encrypted application secrets. This allowed the deployed dashboard to securely connect to the external database without storing database credentials in the application source code.
fly secrets set \
DB_HOST=ep-red-math-b27om077-pooler.c-6.eu-central-1.aws.neon.tech \
DB_PORT=5432 \
DB_NAME=neondb \
DB_USER=neondb_owner \
DB_PASSWORD='<NEON_DB_PASSWPRD>' \
DB_SSLMODE=require \
-a projectzero-threat-intelligence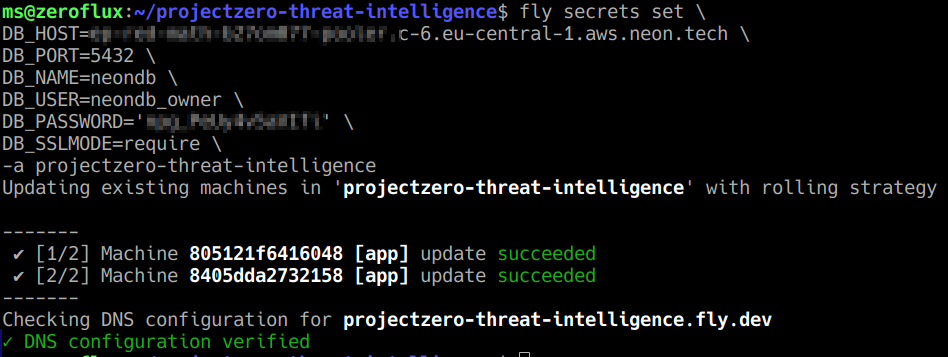
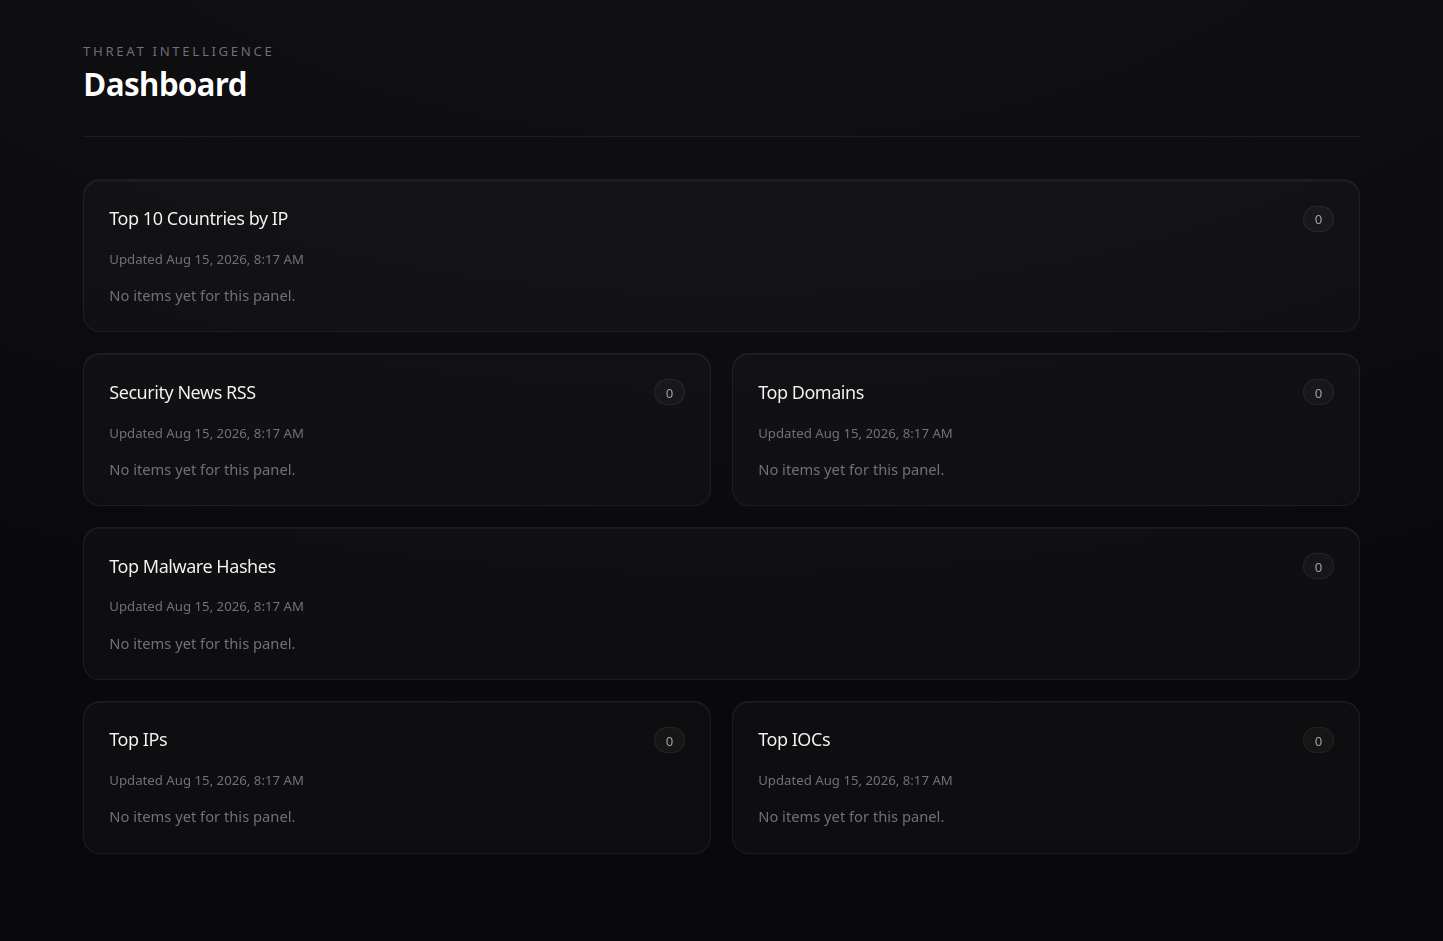
7.Verify Dashboard Deployment
After configuring the database secrets, I verified that the deployed application successfully connected to Neon PostgreSQL and loaded all six threat intelligence dashboard panels.
##CI/CD Implementation (GitHub Actions)
I implemented a GitHub Actions CI/CD pipeline to automate deployment of the ProjectZero Threat Intelligence Dashboard to Fly.io. I integrated the Fly.io deployment configuration into the repository, configured a dedicated deployment token as a GitHub Actions secret, and enabled application changes pushed to the main branch to be automatically built and deployed without exposing deployment credentials in the source code.
1.Merge Fly.io Deployment Configuration
I reviewed and merged the Fly.io generated deployment configuration into the main branch, ensuring the repository contained the required fly.toml configuration before integrating the automated deployment workflow.
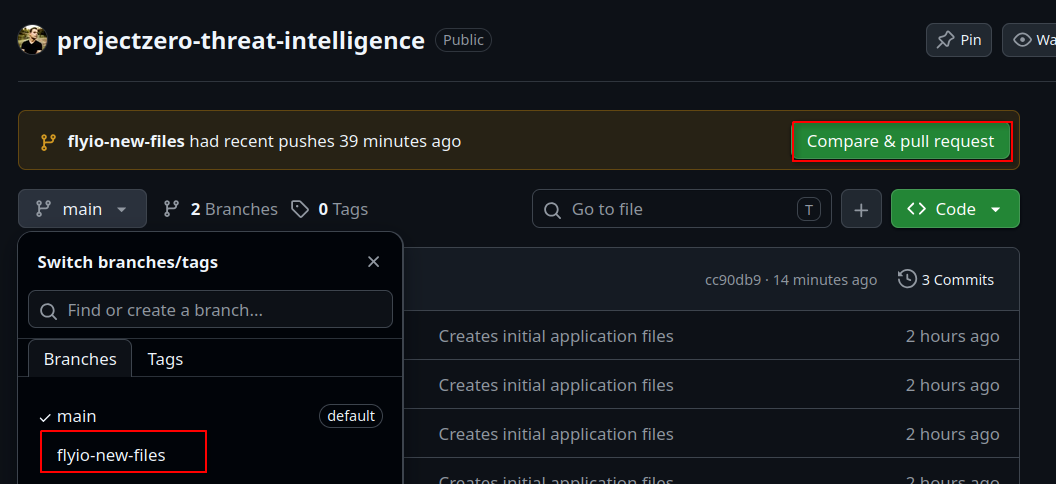
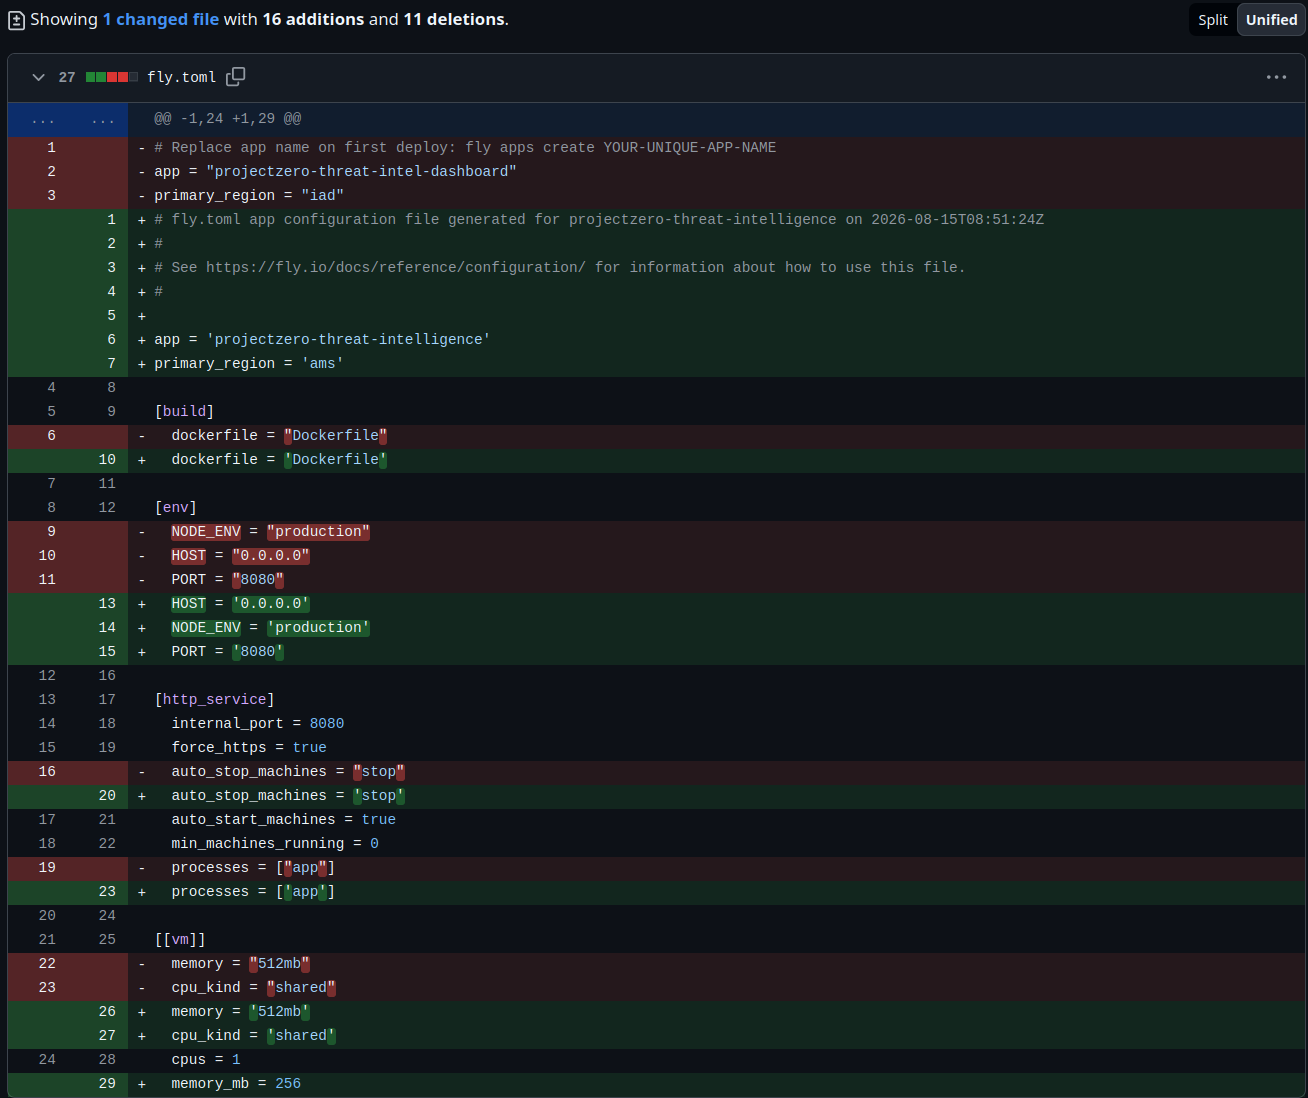
fly.toml configuration before merging it into the application repository.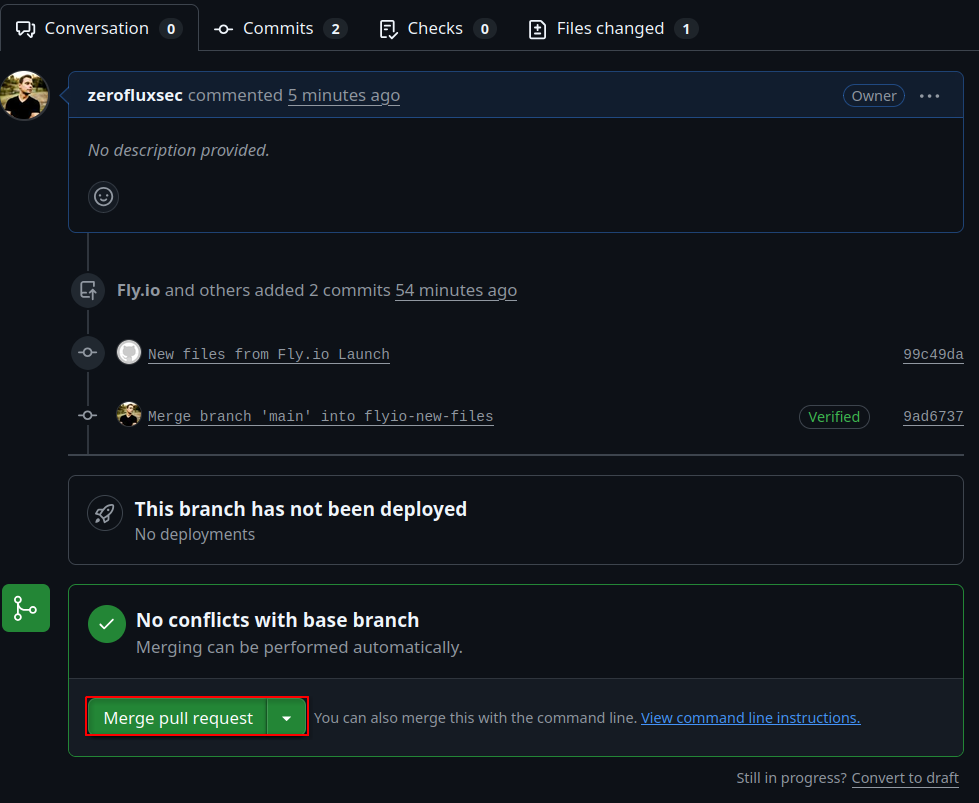
main branch.2.Configure Fly.io Deployment Credentials
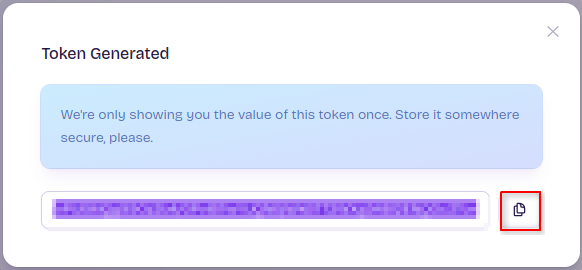
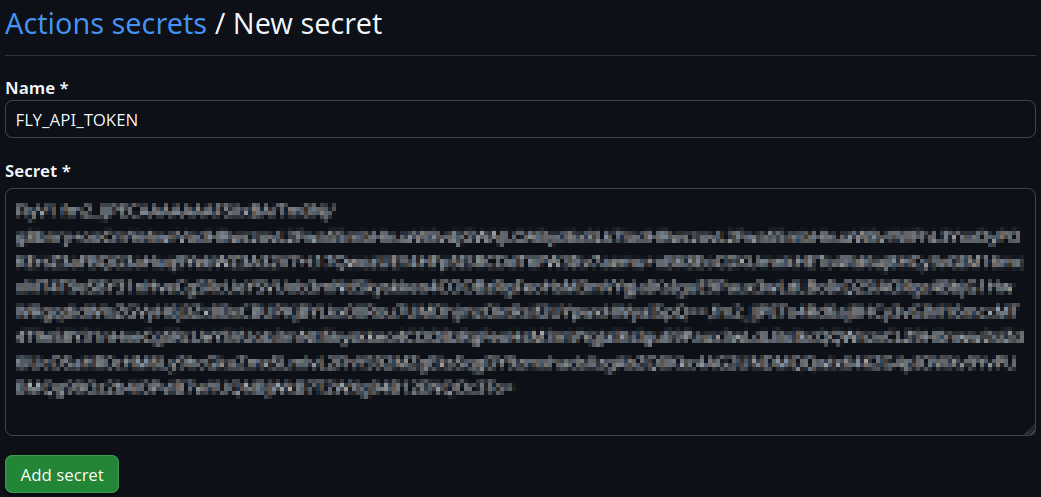
I created a dedicated Fly.io deploy token for the CI/CD pipeline and stored it as the FLY_API_TOKEN GitHub Actions repository secret. This allows GitHub Actions to authenticate with Fly.io and deploy the application without exposing deployment credentials in the repository.
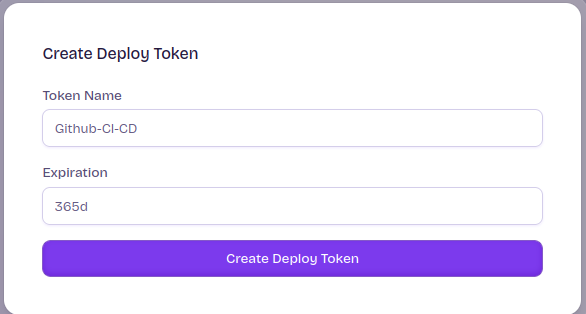
FLY_API_TOKEN GitHub Actions repository secret.#Dashboard Navigation & Production Validation
I finalized the threat intelligence dashboard by adding navigation to supporting portfolio resources, deploying the application updates, and validating the complete production environment. I configured the existing AWS Lambda feed pipeline to use the Neon PostgreSQL database, tested all six threat intelligence feeds, and verified successful data ingestion after the migration. Finally, I configured DNS and TLS for projectzerointel.com and confirmed the production dashboard was successfully serving live threat intelligence data over HTTPS.
1.Add Dashboard Navigation
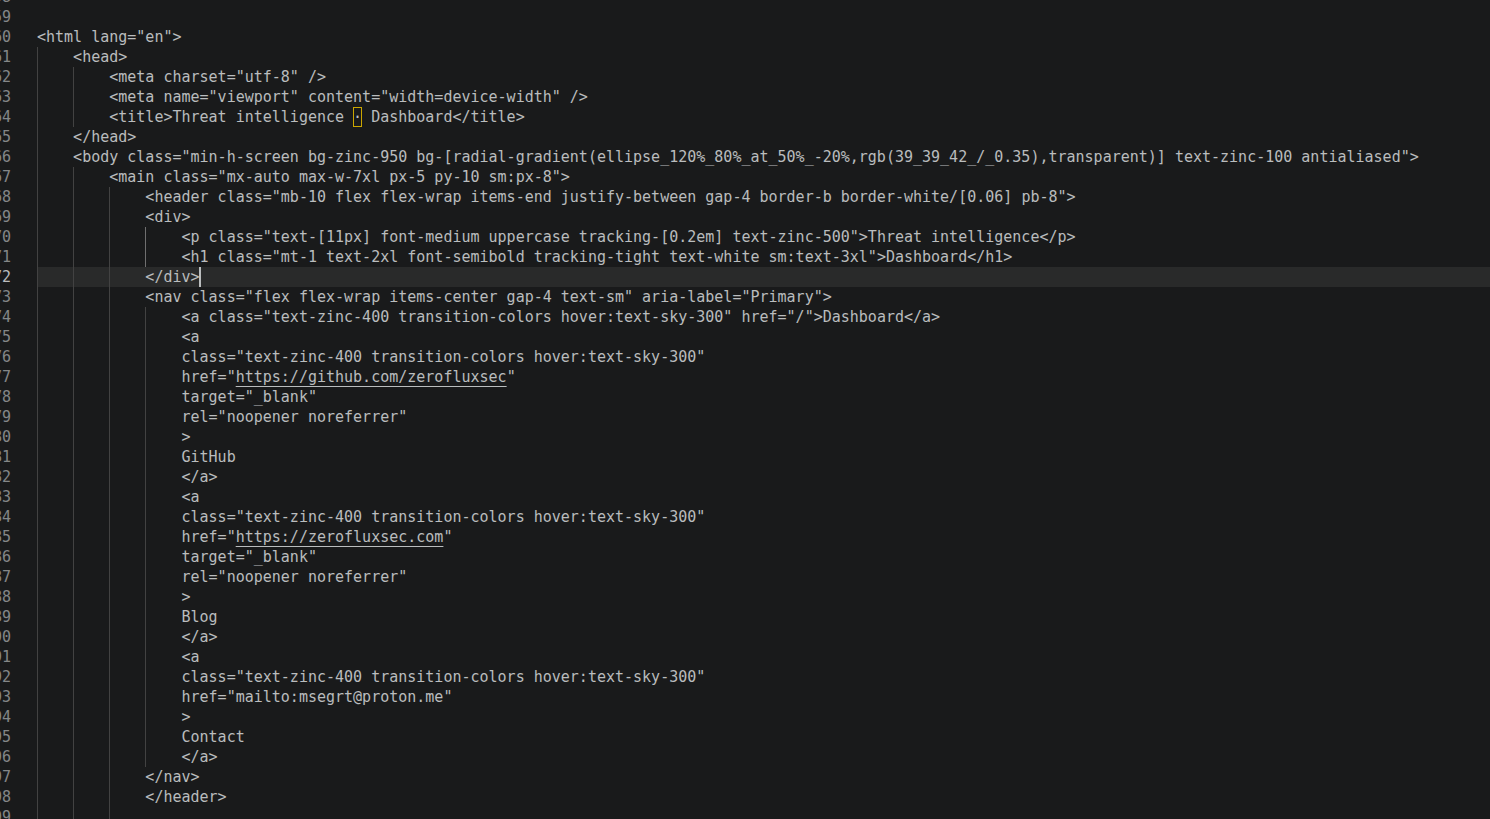
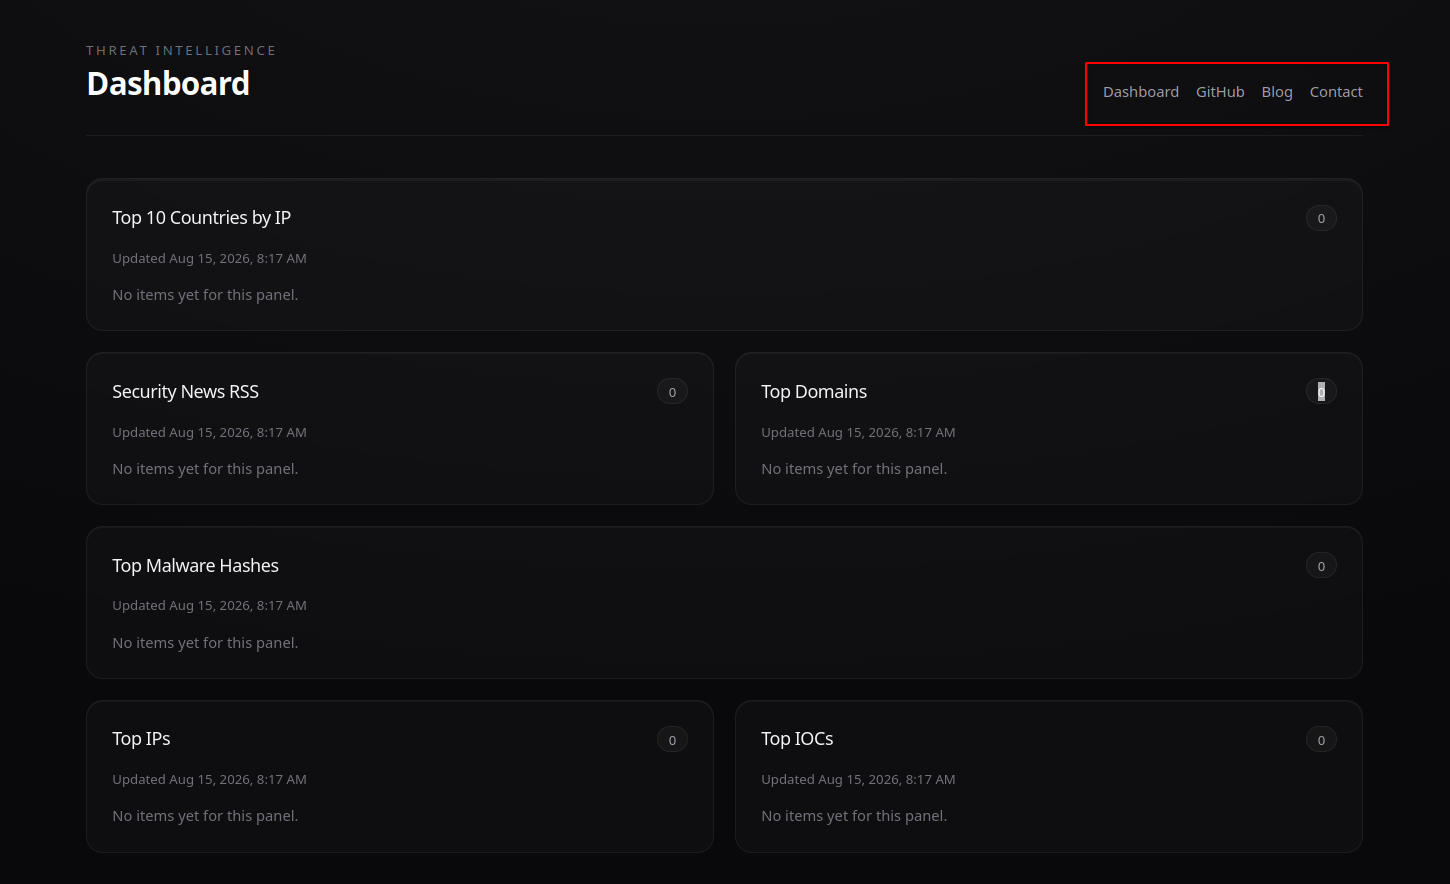
Updated the Astro dashboard header in index.astro to add navigation links for the dashboard, GitHub repository, blog, and contact information.
2.Commit and Push Changes
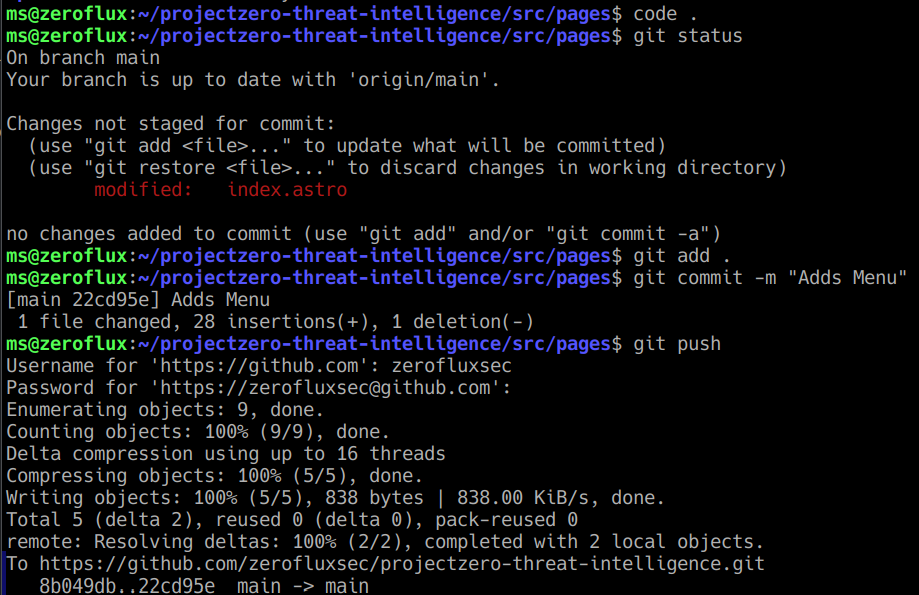
Committed the dashboard navigation changes and pushed the updated application code to the GitHub repository.
3.Deploy Updated Application
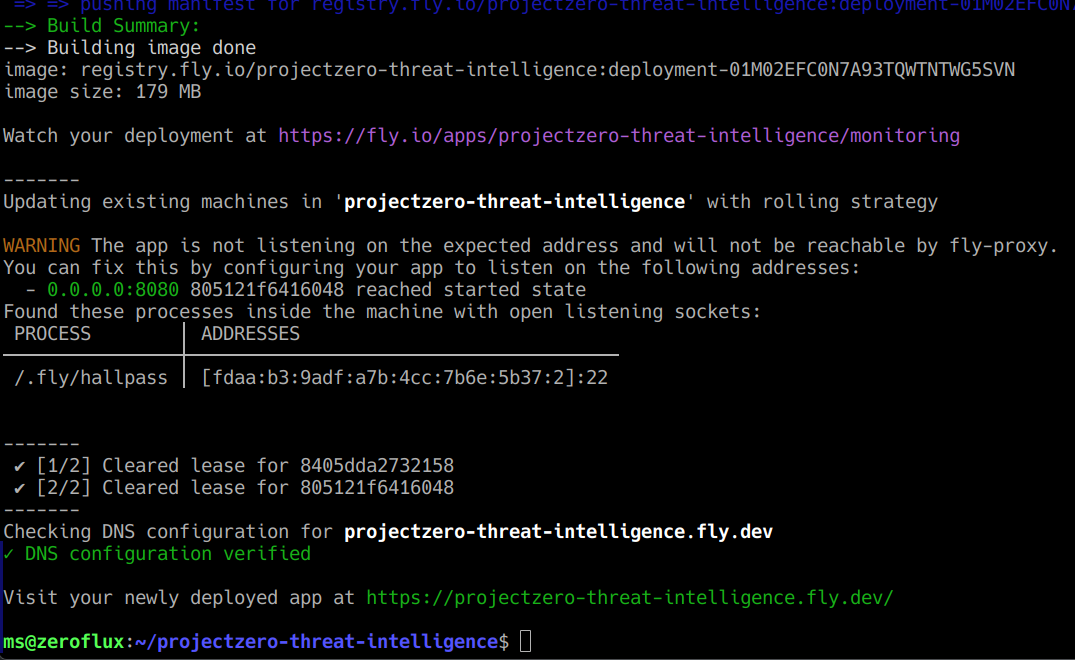
Deployed the updated application to Fly.io and verified that the deployment completed successfully and DNS configuration remained valid.
4.Verify Dashboard Navigation
Verified the deployed dashboard and confirmed that the new navigation menu was successfully rendered in the application header.
5.Configure Neon Database Connection
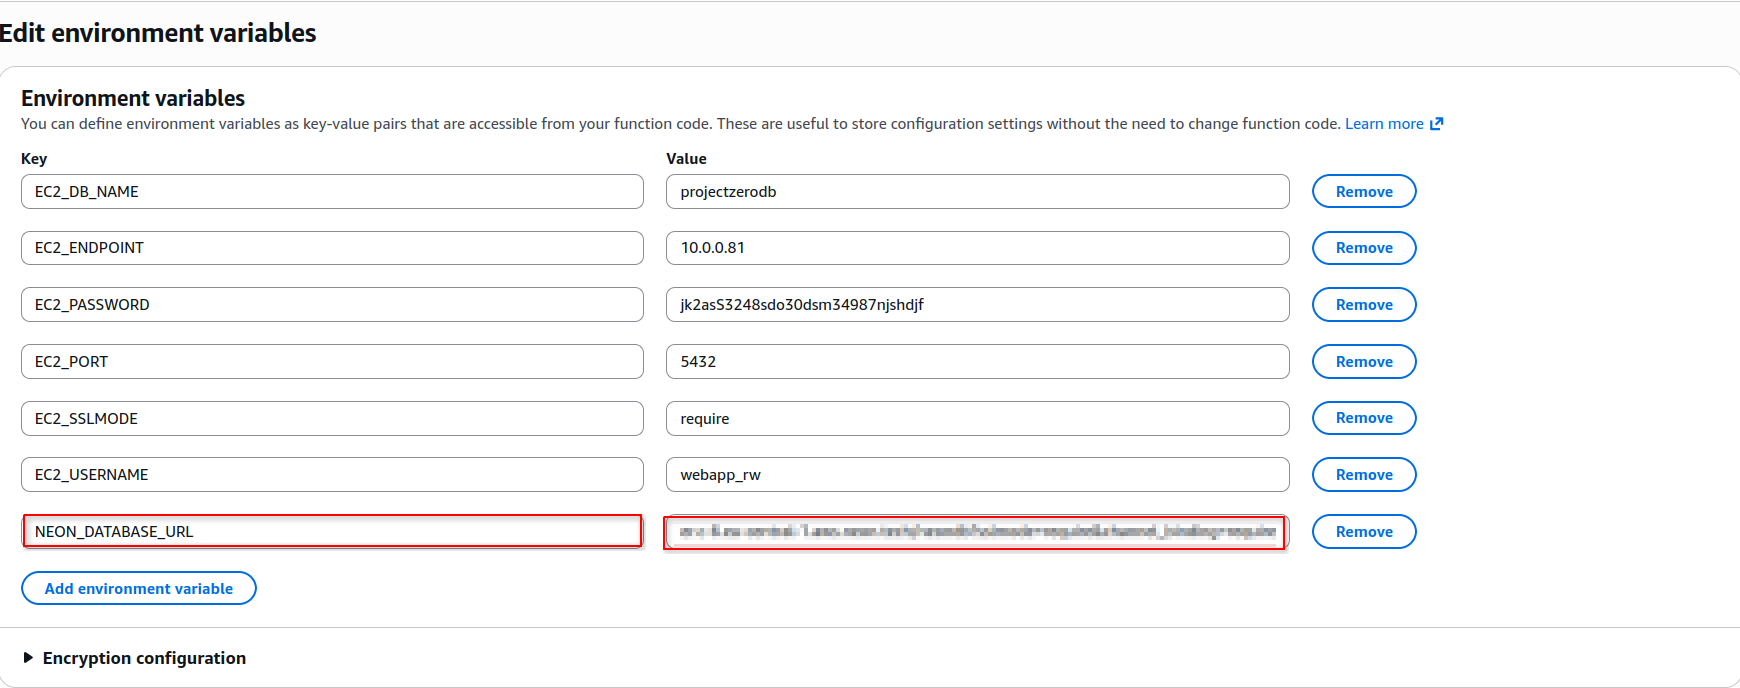
I updated the Lambda environment variables with the Neon PostgreSQL connection string, allowing the existing threat intelligence feed functions to write directly to the new cloud-hosted database.
6.Validate Threat Intelligence Feed Ingestion
I tested each threat intelligence feed Lambda after the database migration to confirm that feed data was successfully processed and written to Neon.
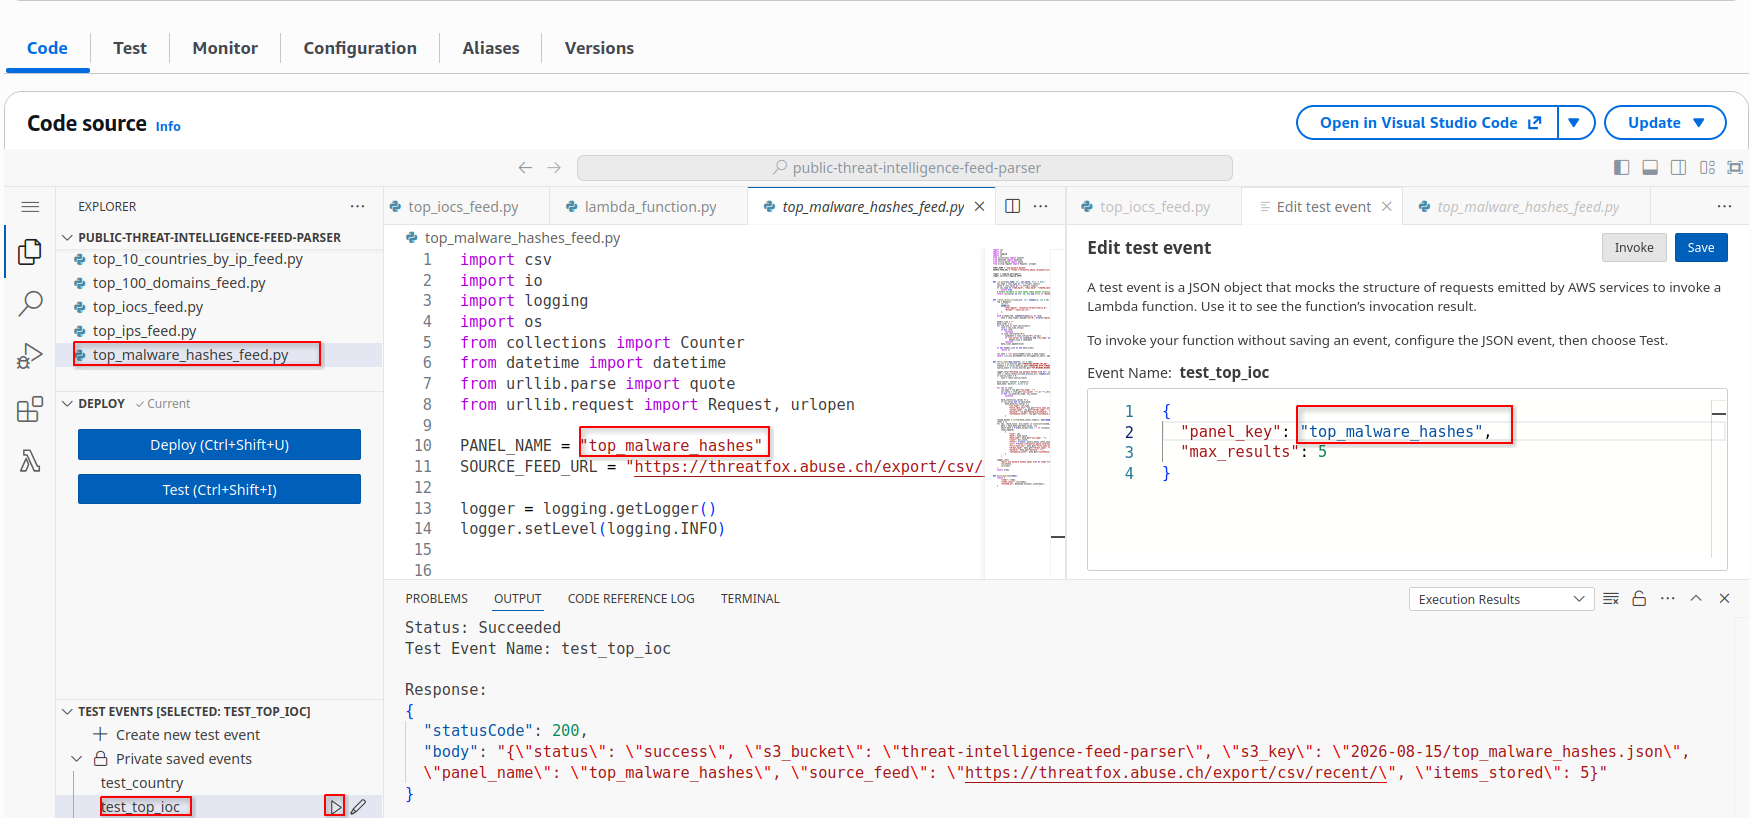
I repeated the validation for all six threat intelligence feeds to confirm that each Lambda could successfully ingest data into the migrated database.
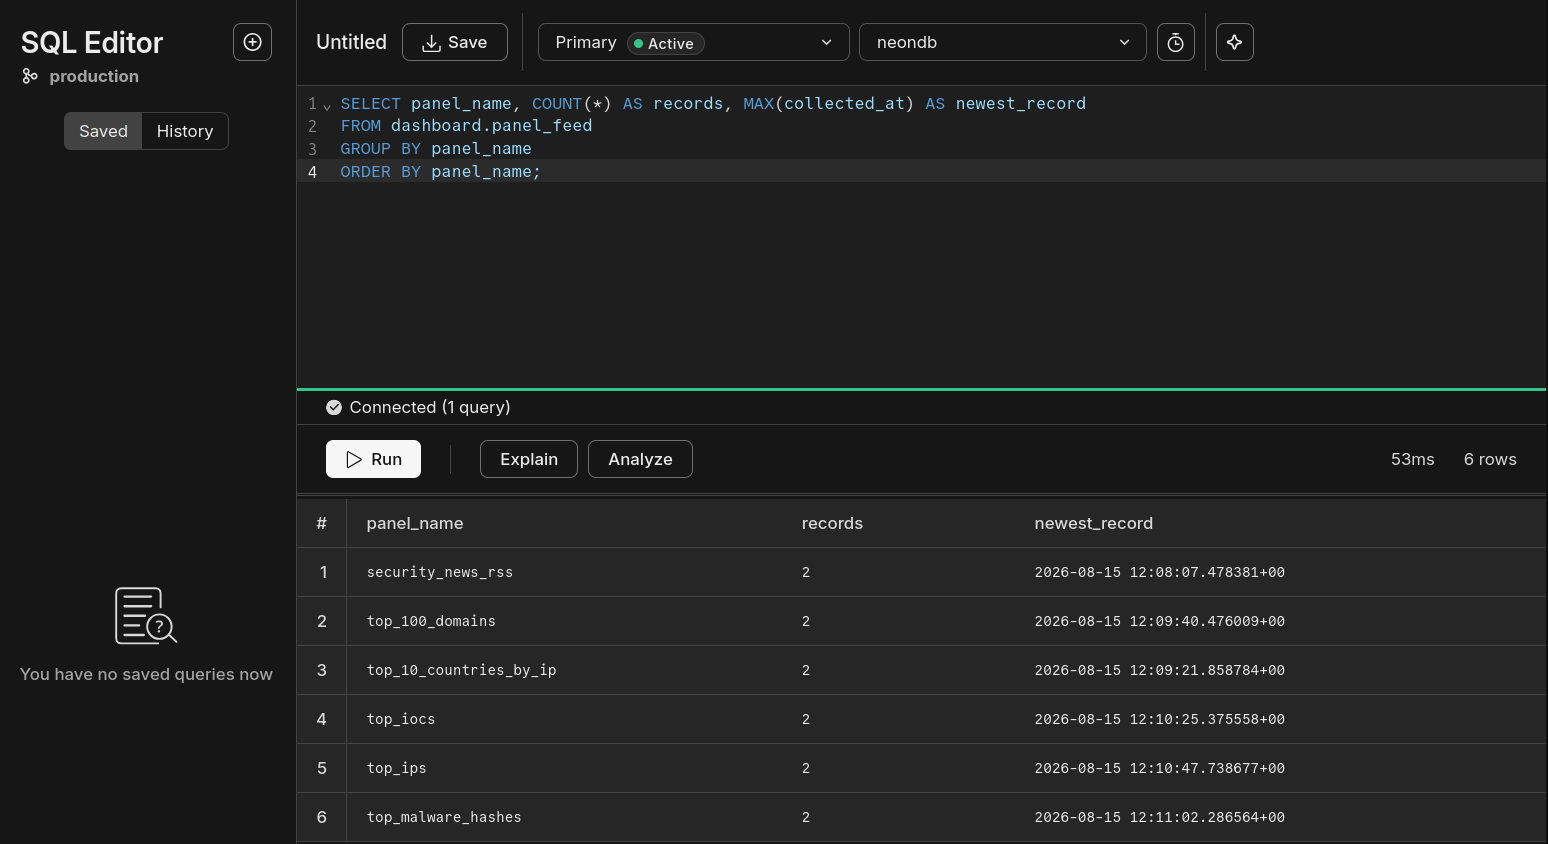
7.Verify Database Migration
I queried the dashboard.panel_feed table in Neon to verify that all six threat intelligence feeds were successfully writing new records after the migration.
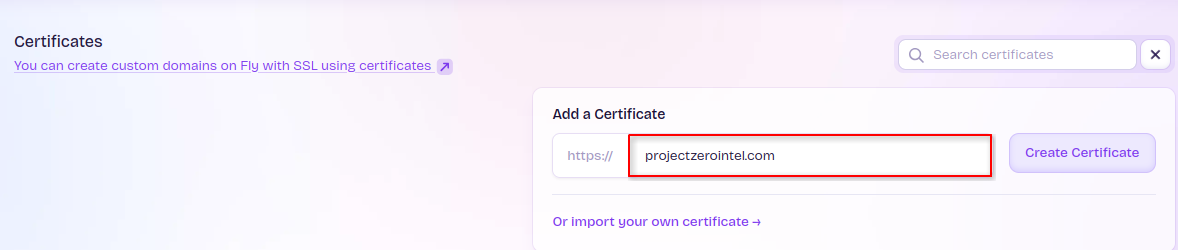
8.Configure Custom Domain
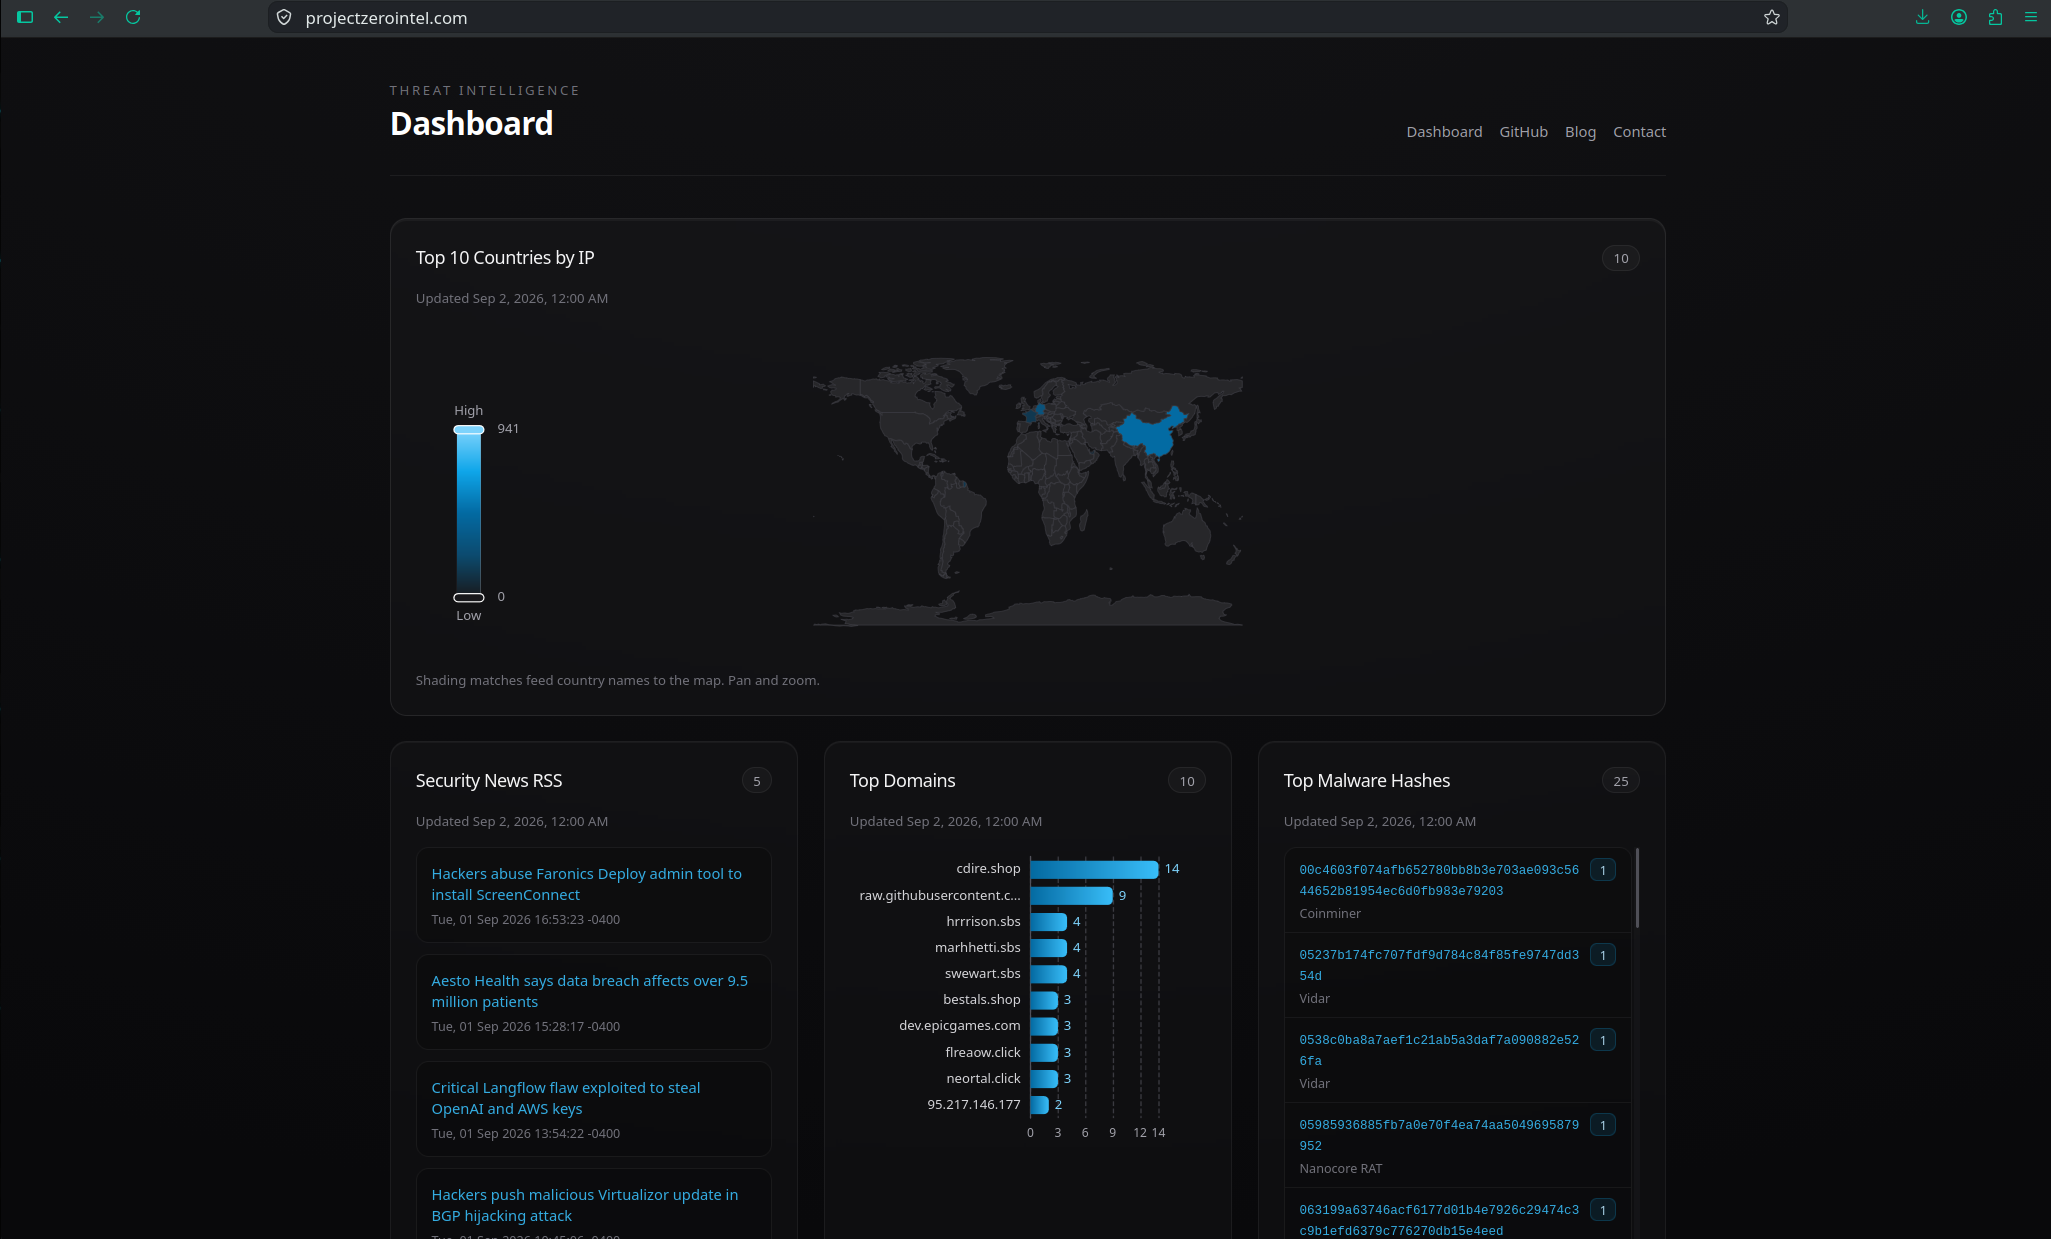
I configured projectzerointel.com as the custom domain for the Fly.io deployment and completed the required DNS and TLS certificate configuration, providing a secure HTTPS endpoint for the production threat intelligence dashboard.
Live Dashboard: projectzerointel.com
#Why It Matters
This project demonstrates the ability to build and operate an end-to-end cloud threat intelligence pipeline rather than simply deploy individual services. I integrated multiple threat intelligence sources through AWS Lambda, automated feed collection with EventBridge, implemented IAM permissions and data retention controls, migrated the application database to Neon PostgreSQL, and deployed the dashboard to Fly.io with GitHub Actions CI/CD. The final environment continuously collects, processes, stores, and presents threat intelligence through a production HTTPS endpoint at projectzerointel.com.
The project provided hands-on experience connecting cloud security, serverless automation, IAM, PostgreSQL, CI/CD, application deployment, and operational validation into a working security platform.