case study
Create a Vulnerable Environment & Detections
In this phase, I intentionally configure my Enterprise lab to be vulnerable so it looks and behaves more like a misconfigured enterprise network instead of a perfectly hardened lab. I enable SSH on my key Linux systems, allow password authentication and root logins with a weak password, and open port 22 through the firewall to simulate exposed remote access. On the Windows side, I turn on WinRM and RDP for remote administration and relax SMB-style access to mirror the kind of legacy file-sharing settings you still see in production. I also create a sensitive secrets file on the domain controller and put it under file integrity monitoring so I can track when it is accessed or exfiltrated during the attack chain. All of these poor choices are deliberate: they give me a realistic attack surface to abuse later and a clean way to show how my detection stack covers credential theft, lateral movement, and data exfiltration across the lab.
###Open SSH on project-zero-corp-svr
On project-zero-corp-svr, I enabled SSH and intentionally weakened the configuration to create a realistic attack surface.
1.Install OpenSSH Server
I made sure the system was up to date and that OpenSSH Server was installed:
sudo apt udpate
sudo apt install openssh-server -y
2.Enable the SSH Service
I enabled and started the SSH service so it runs on boot:
sudo systemctl start ssh
sudo systemctl enable ssh
3.Configure Firewall Access
I opened SSH through UFW to allow inbound connections on port 22:
sudo ufw allow 22
sudo ufw enable
sudo ufw status
4.Verify the SSH Service
sudo systemctl status ssh
5.Configure SSH Authentication
I then weakened the SSH configuration to allow password-based and root logins. I edited the SSH config:
sudo nano /etc/ssh/sshd_config
-I ensured PasswordAuthentication was enabled (uncommented and set to yes).
-I changed PermitRootLogin to yes to allow direct root login over SSH.
6.Apply the Configuration Changes
I applied the configuration changes and set a weak root password (november) on purpose:
sudo systemctl restart ssh
sudo passwd root
This server does not have a Wazuh agent installed by design, to demonstrate how missing visibility on a critical host creates a detection gap.
###Open SSH on project-zero-linux-client
On project-zero-linux-client, I repeated a similar insecure SSH setup to simulate another exposed Linux endpoint.
1.Install OpenSSH Server
I ensured the system was updated and OpenSSH Server was installed:
sudo apt update
sudo apt install openssh-server -y
2.Enable the SSH Service
I started the SSH service and configured it to launch automatically during system startup.
sudo systemctl start ssh
sudo systemctl enable ssh
3.Configure Firewall Access
I allowed inbound SSH traffic through the Ubuntu firewall, enabling remote connections on TCP port 22.
sudo ufw allow 22
sudo ufw status
4.Verify the SSH Service
I verified the SSH service was running:
sudo systemctl status ssh
5.Configure SSH Authentication
I enabled password authentication for SSH:
sudo nano /etc/ssh/sshd_config
-I ensured PasswordAuthentication was enabled (uncommented and set to yes).
6.Apply the Configuration Changes
I restarted SSH and set the same weak root password (november) to keep the environment consistently vulnerable:
sudo systemctl restart ssh
sudo passwd root
###Detection Integration (SSH) 🚨
In this step, I configure an OpenSearch/Wazuh monitor for failed SSH logins by filtering on sshd authentication failures in the wazuh-alerts-4.x-* index, then add a trigger that opens an alert when the count of matching events goes above 2 within 1 hour.
1.Open the Alerting Dashboard
I navigate to the Alerting section in OpenSearch from the Explore menu to start creating a new monitor.

2.Create a New Monitor
I switch to the Monitors tab to view and create alerting monitors.


Because SSH is a common external entry point, I wanted a simple way to detect brute‑force attempts against my Linux hosts. I use Wazuh SSH auth logs to count failed sshd authentication events over a short time window and alert when the failures exceed a small threshold followed by a success. This lets me catch low‑volume brute force against project-zero-corp-svr and project-zero-linux-client without relying on a single signature.
3.Configure the SSH Monitor
I create a new “Per query monitor” named “3 Failed SSH Attempts” using the visual editor so it can evaluate log queries on a schedule.

4.Configure the Wazuh Data Source
I point the monitor at the wazuh-alerts-4.x-* index with @timestamp as the time field so it evaluates Wazuh alert documents over time.

5.Filter SSH Events
I add a data filter where decoder.name is sshd to scope the monitor to SSH‑related events only.

6.Filter Failed Authentication Events
I add another data filter where rule.groups contains authentication_failed so only failed SSH authentication events are counted.

7.Configure the Evaluation Window
I set the monitor’s time range to the last 1 hour so it evaluates failed SSH attempts within a 60 minute window.

8.Add an Alert Trigger
After defining the query filters, I add a trigger so the monitor can generate alerts when the failure count crosses a threshold.

9.Configure the Alert Conditions
I configure a trigger named “3 Failed SSH Attempts” with severity Medium that fires when the number of matching events is above 2.


During the attack simulation, this monitor fires when I run a Hydra brute‑force attack against SSH on project-zero-corp-svr, generating multiple failed logons followed by a successful root login.
###Enable WinRM on project-zero-win-client
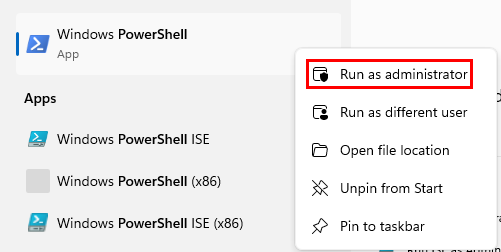
1.Open an Elevated PowerShell Session
Logging intoproject-zero-win-client, opened a new Administrator Powershell session.
2.Configure WinRM
Following commands enable WinRM :
powershell -ep bypass
Enable-PSRemoting -force
winrm quickconfig -transport:https
Set-Item wsman:\localhost\client\trustedhosts *
net localgroup "Remote Management Users" /add administrator
Restart_Servicer WinRM
###🚨 Detection Integration (WinRM)
In this step, I configure an OpenSearch/Wazuh monitor to detect WinRM logons on project-zero-win-client. I use Windows Security Event ID 4624 with logonProcessName set to Kerberos from the wazuh-alerts-4.x-*index, then add a trigger that raises a Medium‑severity alert whenever at least one matching WinRM logon event is observed in the selected time window.
1.Opening the Alerting dashboard
I navigate to the Alerting section in OpenSearch from the Explore menu to start configuring a WinRM alert monitor.
2.Creating a new monitor
I switch to the Monitors tab to view existing monitors and create a new one for WinRM logons.


There’s no specific Windows event for “WinRM enabled,” so I focused on detecting actual WinRM logons. WinRM relies on Kerberos, so I look for Windows Security Event ID 4624 where logonProcessName is Kerberos, which corresponds to successful WinRM logons collected by the Wazuh agent. By alerting whenever these events appear on project-zero-win-client, I can see when an attacker establishes a WinRM session using stolen credentials.
3.Configuring the monitor
I create a new “Per query monitor” named “WinRM Logon” using the visual editor so it can evaluate WinRM events on a schedule.

4.Selecting the Wazuh data source
I configure the data source to use the wazuh-alerts-4.x-* index with @timestamp as the time field so the monitor evaluates Wazuh alert documents over time.

5.Adding query filters
I add a new data filter so the monitor can target specific WinRM‑related Windows Security events.

6.Filtering for successful WinRM logons
I define filters for the WinRM query, selecting logs where the logonProcessName is Kerberos and the eventID is 4624 to capture successful WinRM logons.

7.Add an Alert Trigger
After defining the query, I add a trigger so the monitor can generate alerts when WinRM logon events are detected.

8.Configure the Alert Conditions
I configure a trigger named “WinRM Logon” with Medium severity that fires when the number of matching events is above 1.


Later, this WinRM monitor triggers when I use password spraying from the attacker box to obtain valid credentials and establish a WinRM session on project-zero-win-client.
###Enable RDP on project-zero-dc
In this step, I enable Remote Desktop on project-zero-dcso the domain controller can be accessed over RDP. This simulates a common real‑world scenario where RDP is left open on critical servers and will later feed into Wazuh detections for successful and failed RDP logons using Windows Security Event IDs 4624 and 4625.
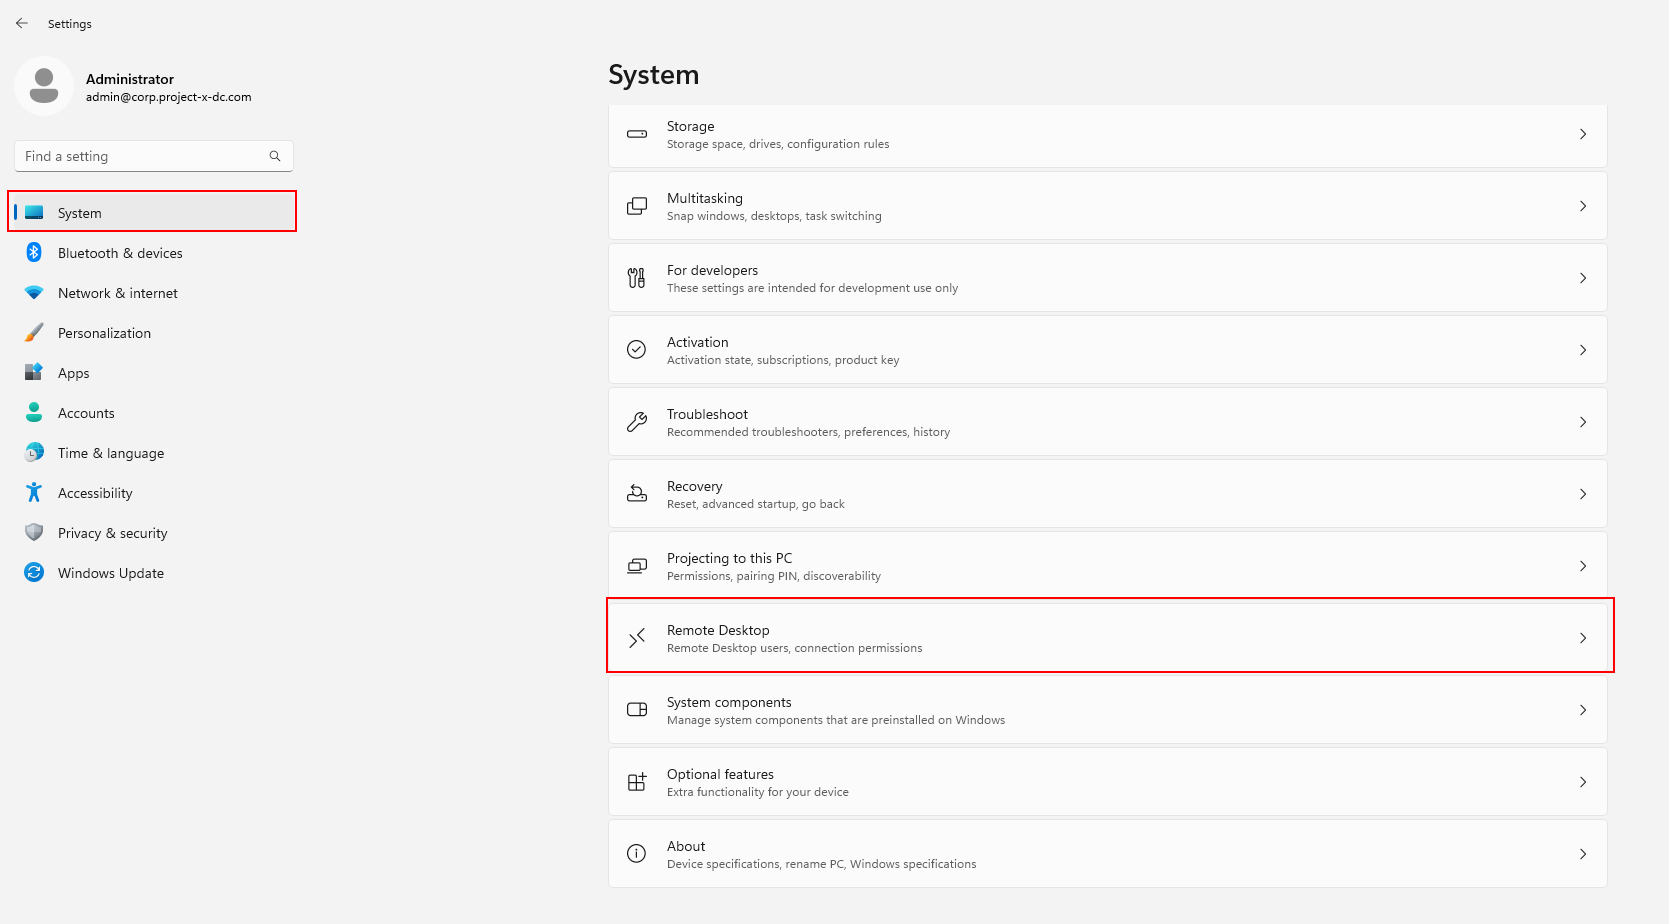
project-zero-dc under Settings → System → Remote Desktop.
project-zero-dc accepts RDP connection.This RDP monitor activates when I pivot to project-zero-dc over Remote Desktop using the stolen credentials, simulating interactive admin access on the domain controller.
###Setup Sensitive Fileproject-zero-dc
In this step, I set up a sensitive file on project-zero-dc that I will later monitor with file integrity rules. I log into project-zero-dc, create a ProductionFiles folder under C:\Users\Administrator\Documents, and add a secrets.txt file containing dummy sensitive data. This gives me a clear target for simulating data theft and testing my FIM and alerting pipeline end‑to‑end.

ProductionFiles folder and secrets.txt on project-zero-dc to simulate a sensitive file.###FIM Coverage for Sensitive secrets.txt File
In this step, I configure Wazuh File Integrity Monitoring to watch the ProductionFiles\secrets.txt file on project-zero-dc.
I update the Windows agent group configuration to monitor the C:\Users\Administrator\Documents\ProductionFiles directory in real time, confirm that secrets.txtappears in the FIM inventory, and then verify that modifying the file generates Wazuh syscheck events that I will later alert on with a custom rule and monitor.
1.Open File Integrity Monitoring
I open the Endpoint security menu in Wazuh and select File Integrity Monitoring to manage FIM settings for my agents.

2.Edit the Windows Agent Configuration
I select the Windows agent group, switch to the Files tab, and edit agent.conf so I can define which paths to monitor.

agent.conf file under the Files tab3.Configure File Integrity Monitoring
Inside agent.conf,I add a syscheck block that monitors C:\Users\Administrator\Documents\ProductionFiles in real time and reports any file changes.

syscheck entry to watch the ProductionFiles directory for changes.NOTE:
<directories check_all="yes" report_changes="yes" realtime="yes">: Defines what directory location to monitor.
check_all defines the FIM module to scan all files in the specified directory.
report_changes enables the system to report content changes made to a file.
<frequency> defines how often the FIM module scans in seconds. The default is every 12 hours.
4.Verify File Inventory
Back in File Integrity Monitoring, I open the Inventory view for the project-zero-dc agent and confirm that
C:\Users\Administrator\Documents\ProductionFiles\secrets.txt now shows up as a tracked file.


secrets.txt appears in the FIM inventory for project-zero-dc5.Verify File Change Events
In the Events view, I modifysecrets.txt and see Wazuh syscheck events indicating the file was added and its integrity checksum changed, proving FIM is capturing access to this “sensitive” file.

During the attack simulation, this FIM configuration lets me see when an attacker reads or modifies C:\Users\Administrator\Documents\ProductionFiles\secrets.txt on project-zero-dc, so I can detect suspicious access to sensitive data.
###FIM coverage on secrets.txt into a alert
In this step, I turn the FIM coverage on secrets.txt into a high‑signal alert. I add a custom Wazuh rule in local_rules.xml that matches syscheck events where secrets.txtis modified, then create a “File Accessed” monitor in OpenSearch that watches the Wazuh alerts index for those events. This gives me a clear, high‑severity alert any time an attacker touches the simulated sensitivefile on project-zero-dc.
1.Open the Wazuh Rules Configuration
I go to Server management → Rules so I can edit the custom rules file used by Wazuh.

2.Open the Custom Rules File
I search for local_rules.xml and open it, since this is where I store custom rules for my lab.

local_rules.xml to define a custom FIM rule for secrets.txt.3.Create the Custom FIM Rule
At the bottom of local_rules.xml, I add a new syscheck rule that looks for events where the file name is secrets.txt and the event is marked as modified.

secrets.txtand save the rule file and restart Wazuh so the new FIM rule takes effect.4.Create the FIM Monitor
In OpenSearch, I create a new “Per query monitor” named “File Accessed” to alert on FIM events for the sensitive file.

5.Configure the Wazuh Data Source
I configure the data source to use the wazuh-alerts-4.x-* index with @timestamp as the time field so the monitor evaluates Wazuh alerts over time.

wazuh-alerts-4.x-* index and @timestamp.6.Validate the Custom Detection
Using a sample FIM event, I confirm that syscheck logs show secrets.txt as modified and contain the custom rule metadata I added.

secrets.txt integrity changes.7.Filter the Target File
I add a data filter where full_log contains secrets.txt so the monitor only looks at FIM events involving the sensitive file.

secrets.txt to scope to the sensitive file.8.Filter File Modification Events
I add another data filter where syscheck.event is modified to focus on content changes to secrets.txt.

9.Configure the Alert Conditions
I configure a trigger named “File Accessed” with High severity that fires when the count of matching events is above 1.

During the attack simulation, this alert fires when I edit or exfiltrate secrets.txt on project-zero-dc, giving me a clear signal that a sensitive file was accessed.
Why this matters
This setup demonstrates that I can design an attack surface on purpose, understand which logs and fields reveal attacker behavior, and implement end‑to‑end detections that catch those behaviors across Linux and Windows systems.